Table of Contents
Introduction
In this tutorial, we will see how to monitor Veeam using PRTG.
Having the results of the backups in PRTG makes it possible to centralize the monitoring of the infrastructure in a single console and to reduce notification emails.
Prerequisites
On the PRTG server, it is necessary to install the Veeam management console, it must be at the same version as the Veeam server itself.
Recover the archive below which contains the script and PSx64:
Sources :
Script installation
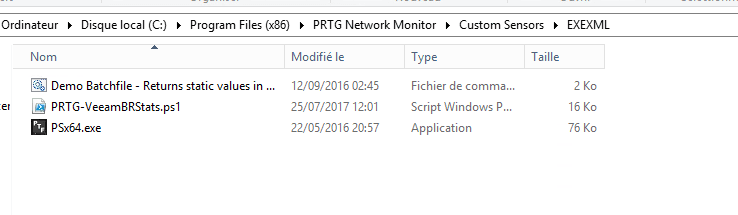
Copy the files from the archive to the following folder: C: Program Files (x86) PRTG Network Monitor Custom Sensors EXEXML.
Script configuration
Edit the PRTG-VeeamBRStats.ps1 file on line 47, replace localhost with the name of the Veeam server in the variable $ BRHOST = “”
param(
    [Parameter(Position=0, Mandatory=$false)]
        [string] $BRHost = "localhost",
    [Parameter(Position=1, Mandatory=$false)]
        $reportMode = "24", # Weekly, Monthly as String or Hour as Integer
    [Parameter(Position=2, Mandatory=$false)]
        $repoCritical = 10,
    [Parameter(Position=3, Mandatory=$false)]
        $repoWarn = 20,
    [Parameter(Position=4, Mandatory=$false)]
        $selChann = "BCRE", # Inital channel selection
    [Parameter(Position=5, Mandatory=$false)]
         [switch] $PSRemote
)
Sensor configuration
Add a sensor in PRTG:
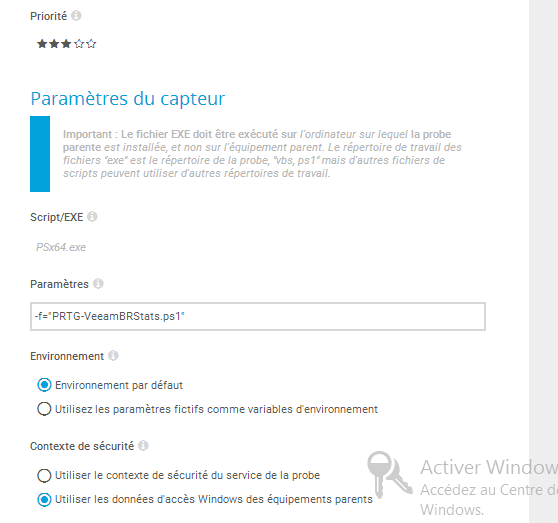
Adjust the interval according to the backup cycle, 1H is a good value
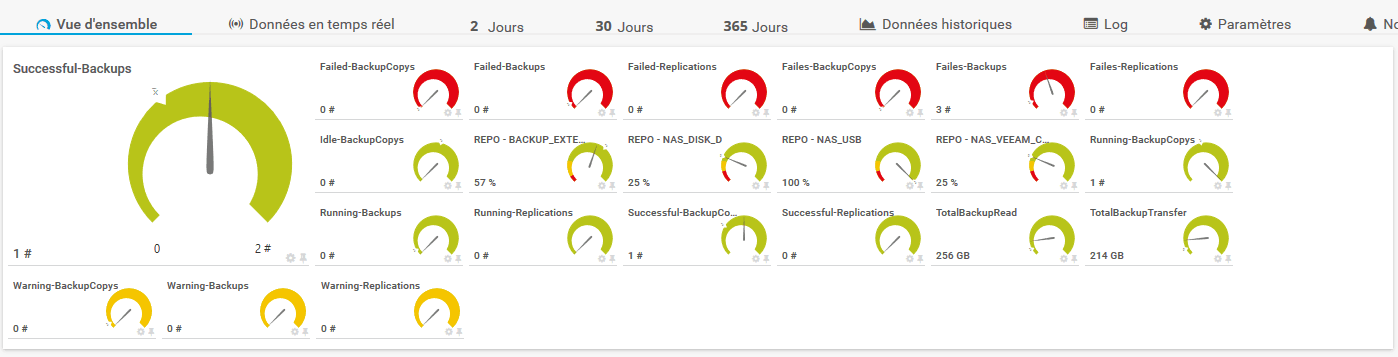
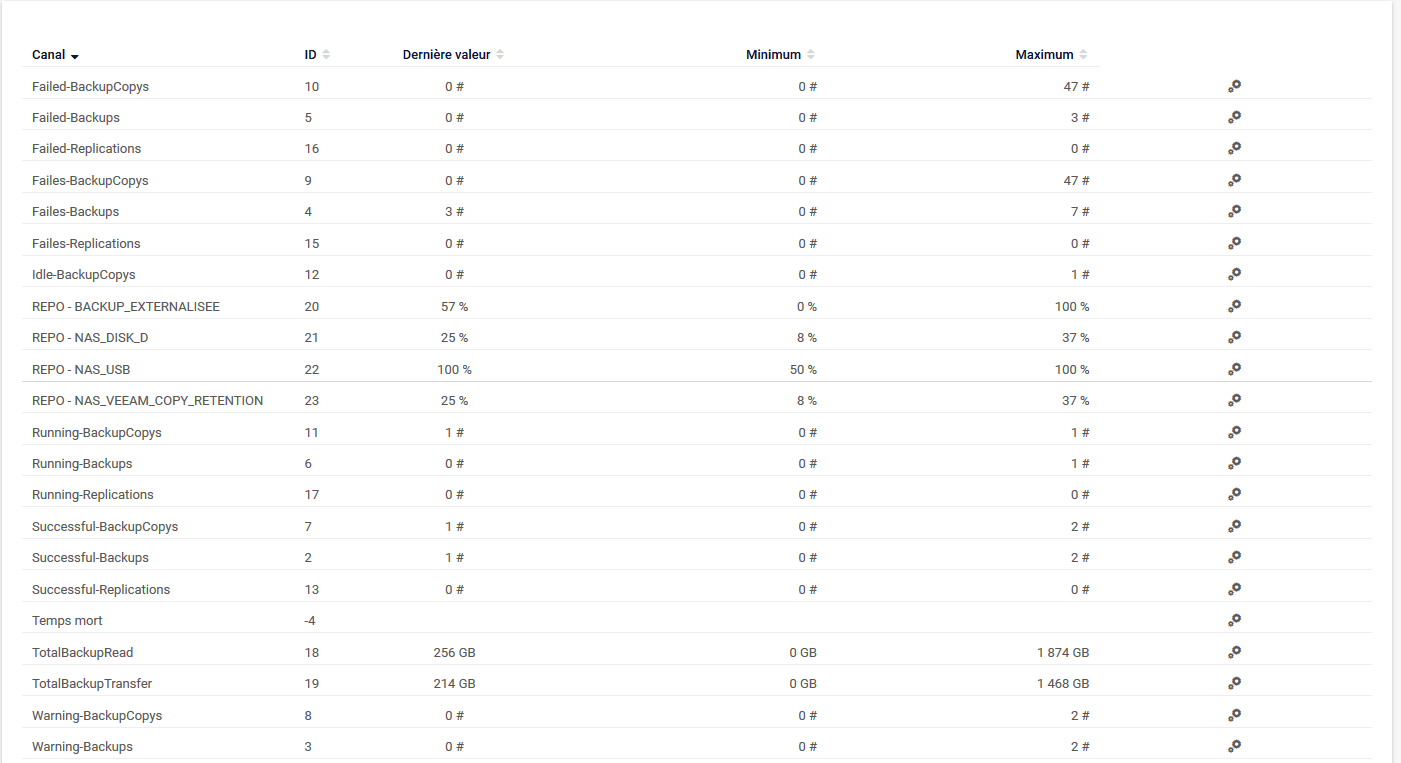
Overview of sensors:

Hi,
Your solution seems me to me plain and simple. However I get the following error code. Any idea what might be the cause?
XML: The returned XML does not match the expected schema. (code: PE233) — JSON: The returned JSON does not match the expected structure (Invalid JSON.). (code: PE231)
Hi,
Have you tried with the V3 file: https://github.com/vMarkusK/Advanced-PRTG-Sensors/blob/master/Veeam/PRTG-VeeamBRStats-v3.ps1
You can verify correct operation by running the PowerShell file directly to see if an error occurs during execution.