In this tutorial, I will explain how to send decision logs to Elasticsearch (ELK) so that you can create a dashboard to use the logs.
What you need to achieve what described in the tutorial:
- Crowdsec version 1.2.x or higher
- an Elasticsearch server or an ELK stack
Since version 1.2 of Crowdsec, a notification system has been added which allows to perform an action when a decision is applied. Here we will see how to send this information to ELK.
Special case of Crowdsec update to version 1.2 or higher
Before talking about the configuration to send Crowdsec logs to Elasticsearch, I will dwell on a particular point, if you have installed Crowdsec with version 1.2 and you have updated it, it is necessary to add settings in the Crowdsec configuration, because as I said before, the notification system was added in version 1.2.
Check the following elements in the Crowdsec configuration file: /etc/crowdsec/config.yml, if they are not present, add them.
config_paths :
#/etc/crowdsec/config.yaml on Ubuntu
config_paths:
  notification_dir: /etc/crowdsec/notifications/
  plugin_dir: /usr/lib/crowdsec/plugins/
plugin_config :
#/etc/crowdsec/config.yaml
plugin_config:
  user: nobody
  group: nogroup
Check that the folders in configure in config_paths exist:
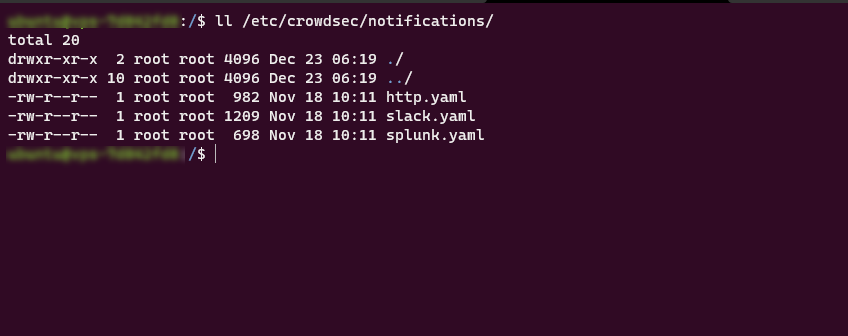
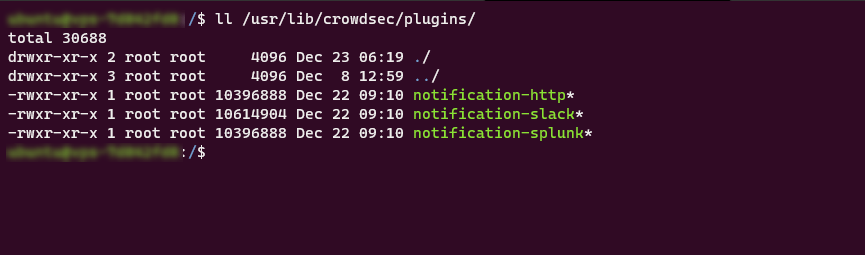
Everything is good, we can now move on to the configuration of the notification to send the information on ELK.
Configure sending Crowdsec logs to Elasticsearch
On the documentation available on the Crowdsec site, it uses the http.yml configuration file to send configure the sending of logs.
The problem, if you want to make several http notifications, the configuration file will quickly become “complicated”, what we will do is create a file for elk.
Go to folder /etc/crowdsec/notifications.
cd /etc/crowdsec/notificationsDuplicate the http.yml to configure send to ELK:
sudo cp http.yml elk.ymlOpen the file with nano to edit it:
sudo nano elk.ymlEdit the configuration file as below by modifying line 12 with the url of your elastic:
type: http # Type de notification

name: http_elk # this must match with the registered plugin in the profile
log_level: trace # Options include: trace, debug, info, warn, error, off

format: |-
 {{ range .}}
  {"index": { "_index": "crowdsec"} }
  {{.|toJson}}
 {{ end }}

url: http://elastic.url.com/_bulk

method: POST
headers:
 Content-Type: "application/json"
We now need to configure Crowdsec to use our configuration file.
Go to folder /etc/crowdsec :
cd ..
# or
cd /etc/crowdsec
Open the profiles.yaml file:
sudo nano profiles.yamlFor safety, before editing, you can save the file sudo cp profiles.yaml profiles.yaml.bk.
Avant on_success: break we will indicate the use of notifications:
.....
notifications:
   - http_elk # name of notification
.....
It’s configured, all you have to do is restart the crowdsec service:
sudo systemctl restart crowdsecVisualization in ELK
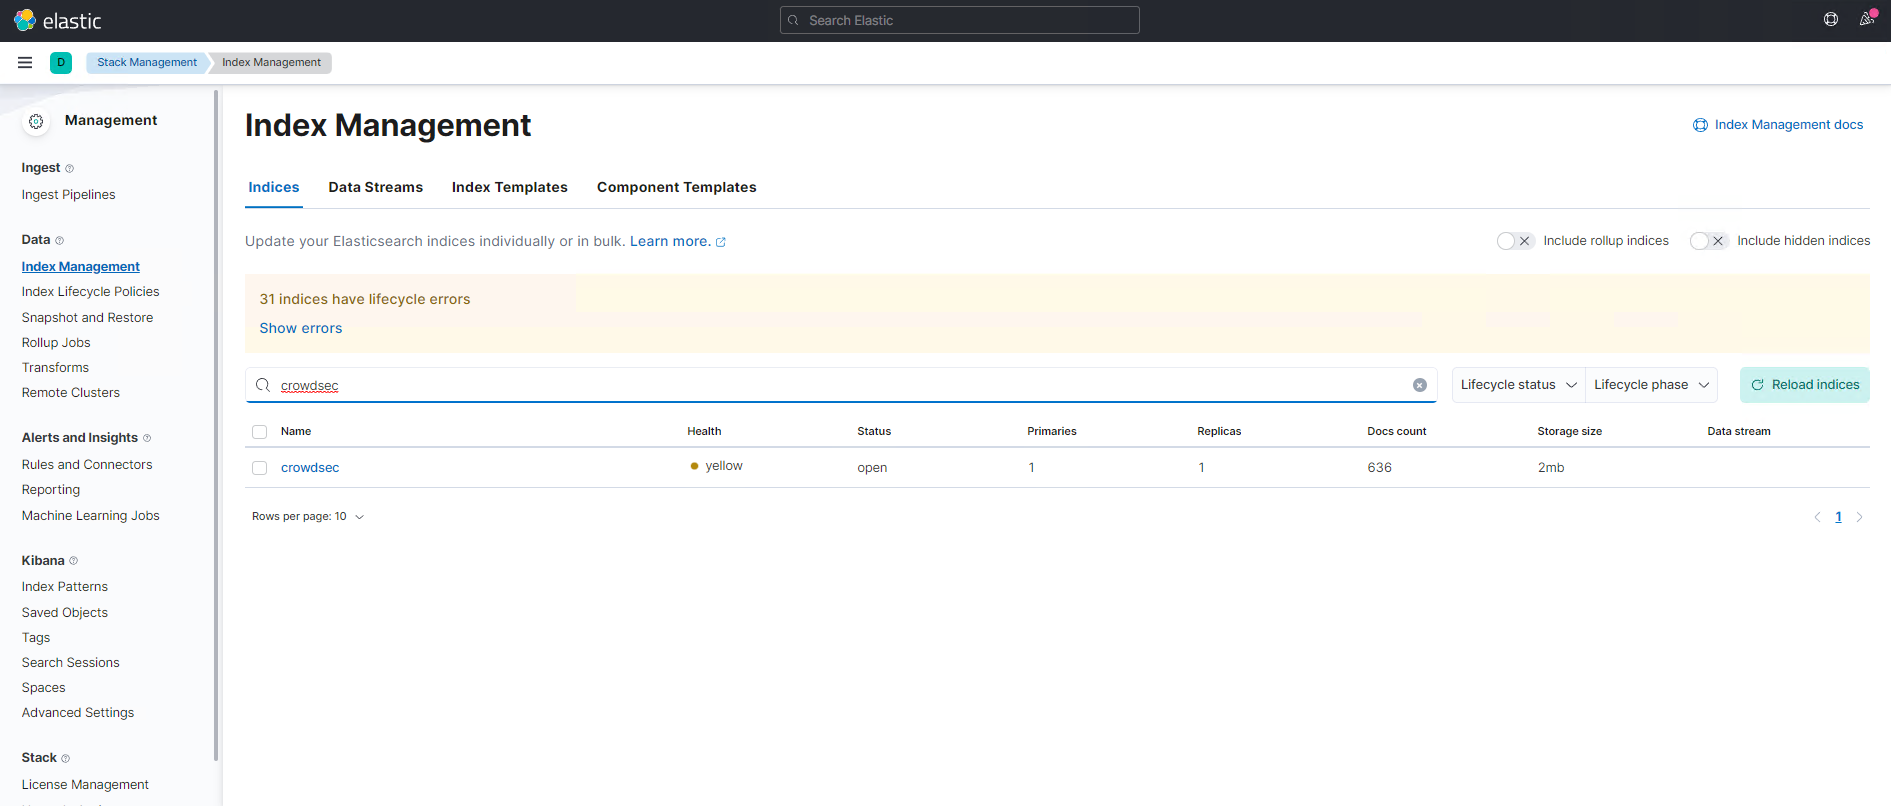
Creating the index in Elasticsearch can take time, as notifications are sent only when a decision is made.
In the elasticsearch index management, we find our crowdsec index:
In the Kibana indexes pattern, create an index to view the Crowdsec logs:
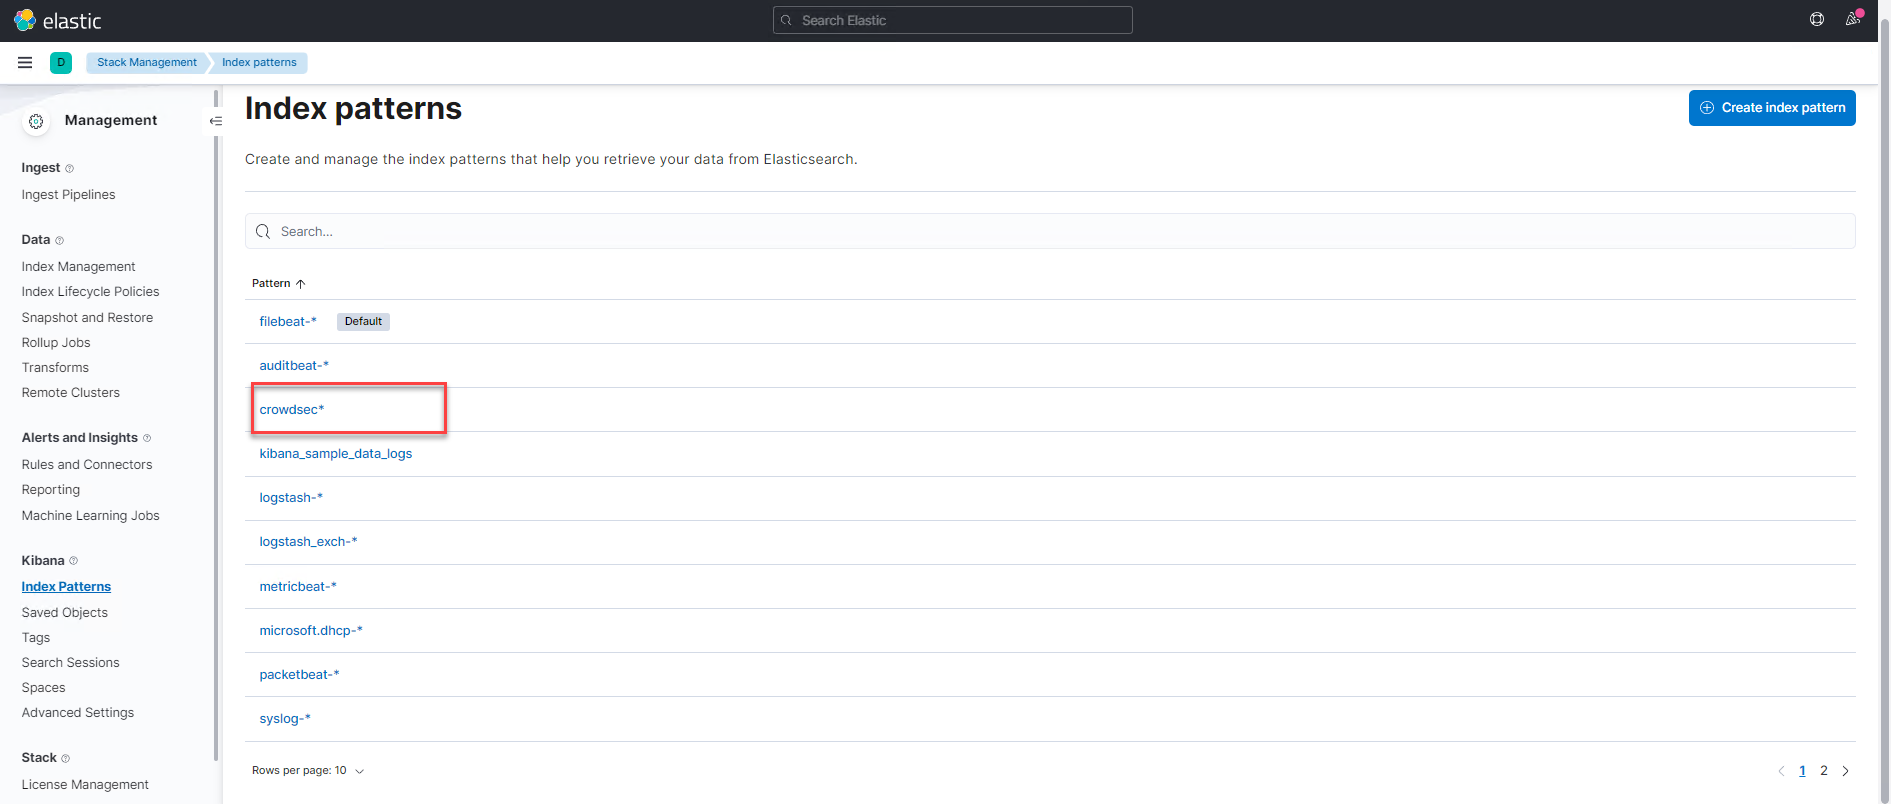
You will then have access to the logs in the Discover section:

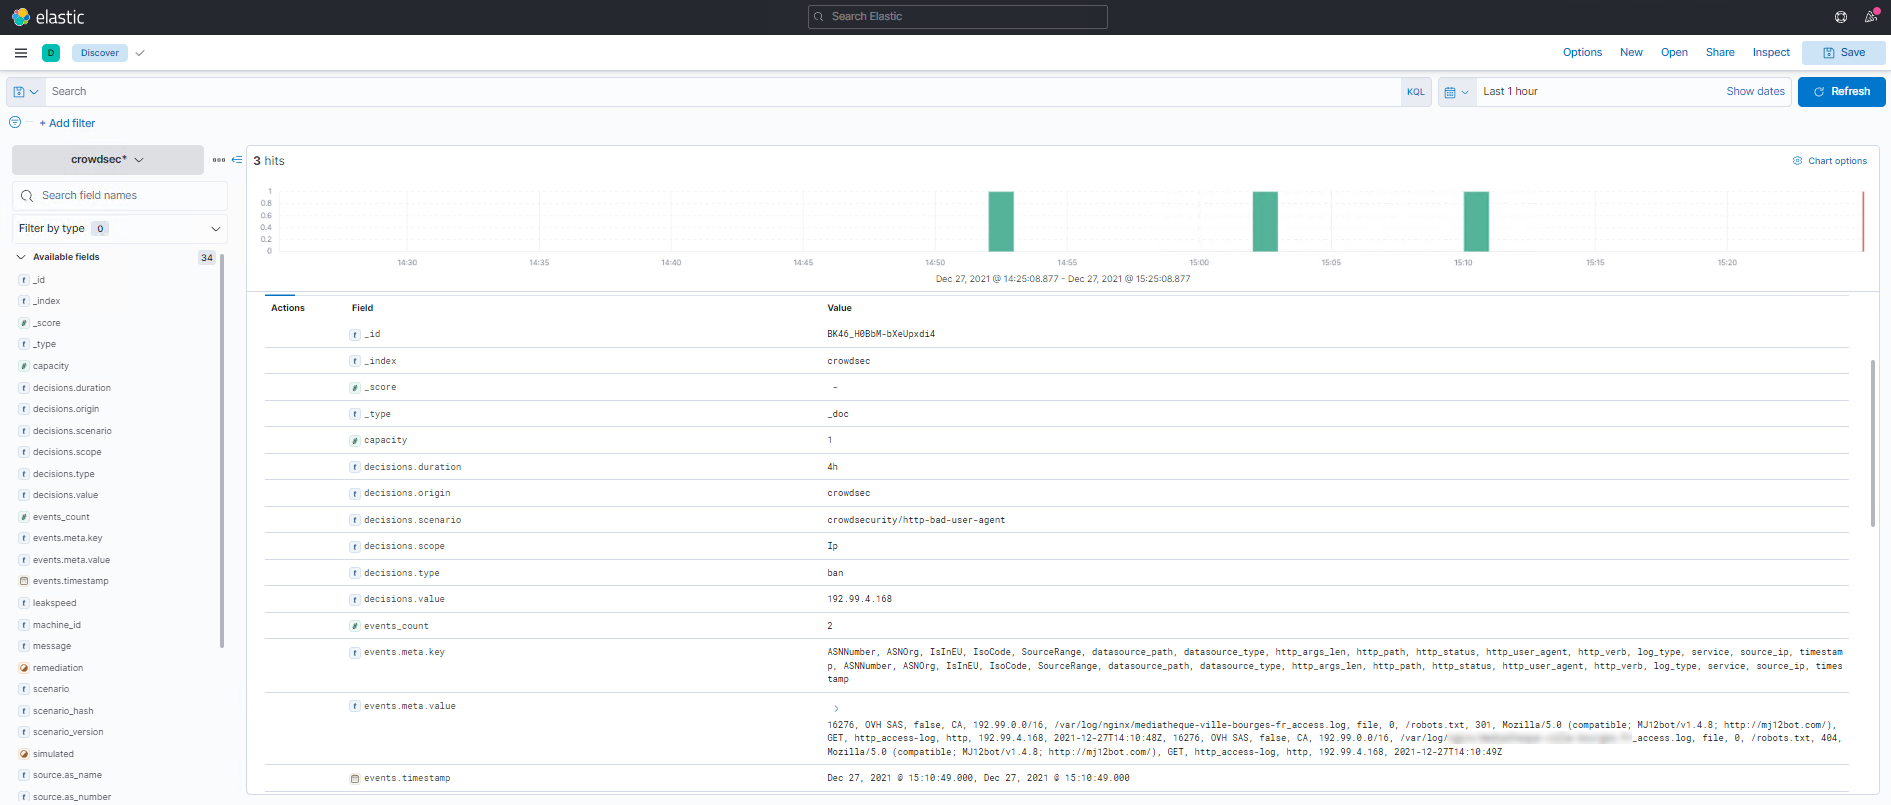
You can now create a dashboard with Crowdsec information to analyze the different blockages and visualize the different “attacks”