In this new tutorial dedicated to Zabbix, I will explain how to monitor a web server under Nginx in order to have performance metrics.
For monitoring, Zabbix agent should be installed on Nginx server, as we will use it to collect statics which will then send to Zabbix monitoring server.
Before configuring monitoring at Zabbix level, you must check at Nginx level that the status module is activated and then configure it at the virtualhost level.
On the Nginx server enter the command below to verify that the status module is present:
nginx -V 2>&1 | grep -o with-http_stub_status_module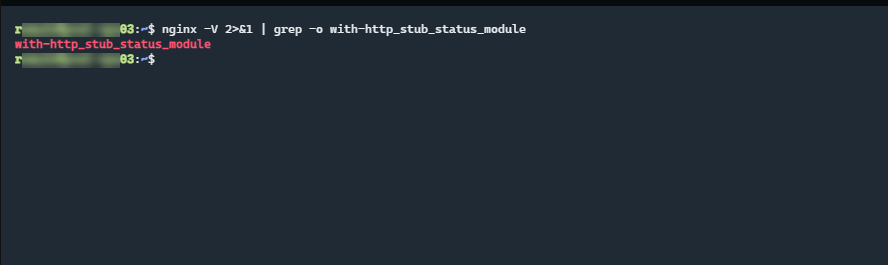
If the name of the module is displayed as on the screenshot, it is installed
We will now add an instruction block in the default virtualhost, in order to be able to query the status page to get the statistics.
Edit the default (/etc/nginx/sites-available/default) which contains the default nginx virtualhost information.
In the server{} block add the location{} block below:
location = /basic_status {
                stub_status;
                allow 127.0.0.1;
                allow ::1;
                deny all;
}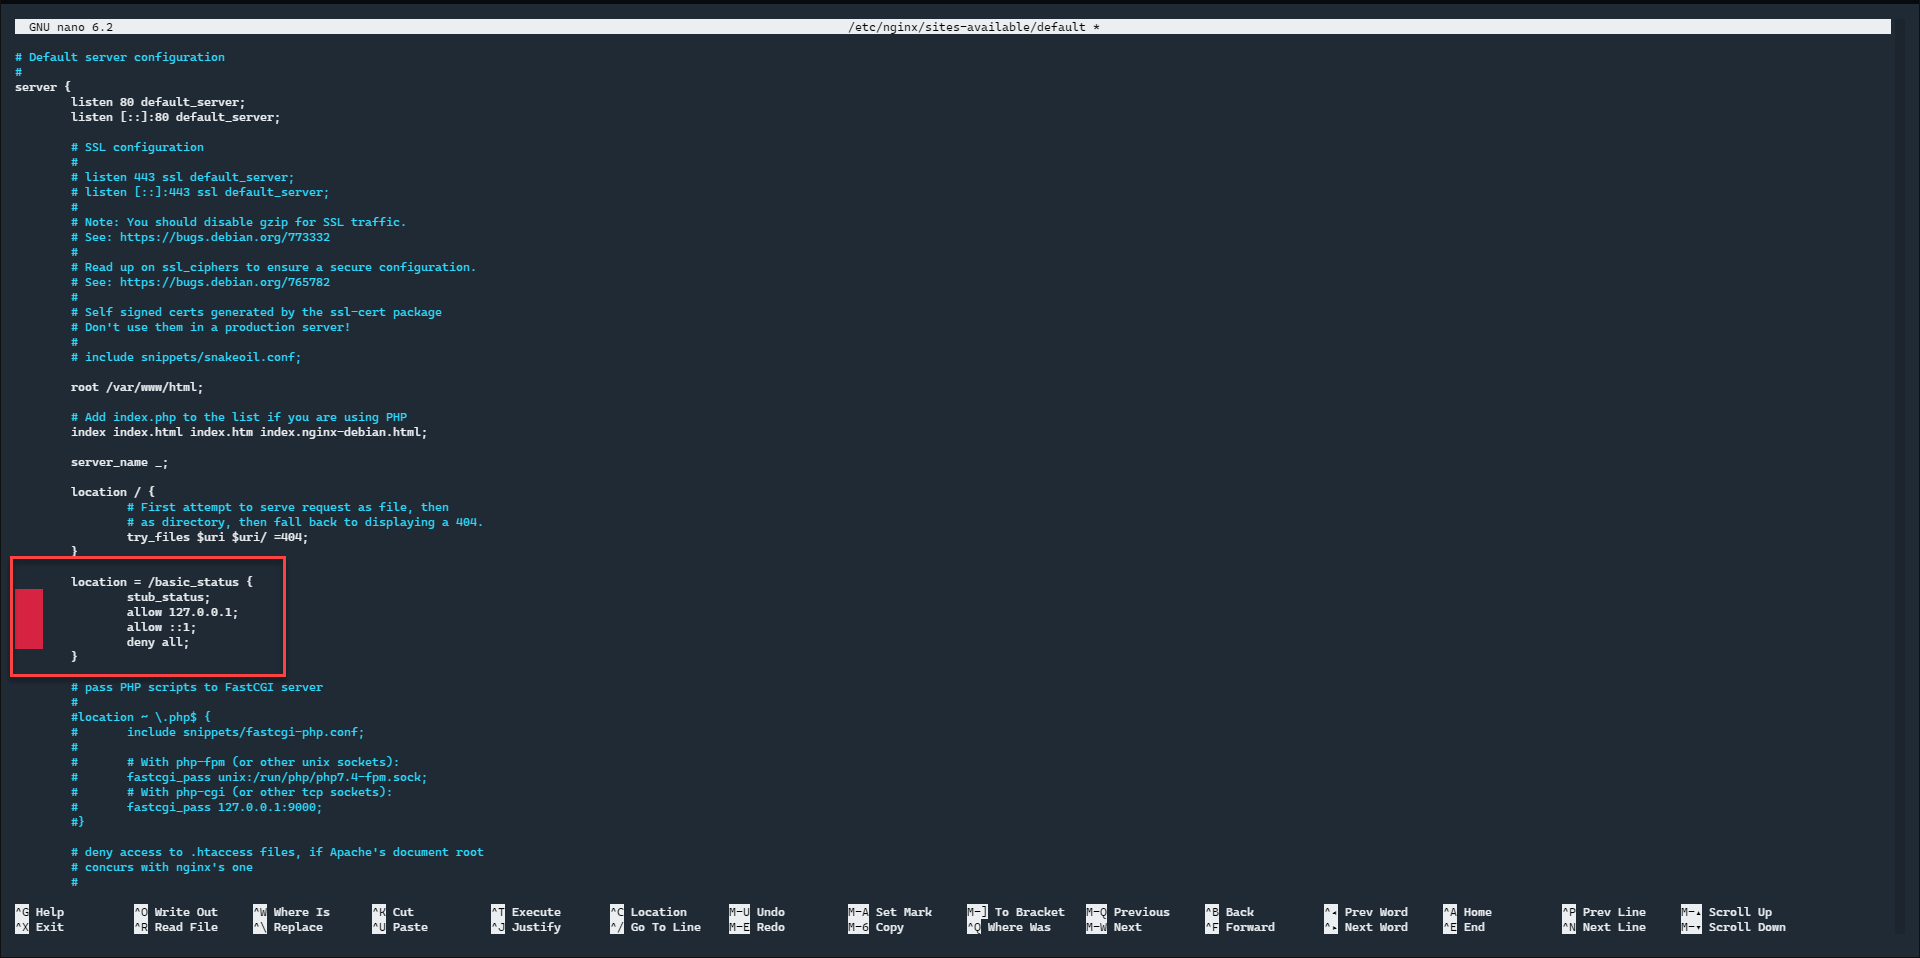
This block displays Nginx statistics by calling the basic_status URL. We also limit access only from the IP 127.0.0.1, which only allows a local call, which we want, because it is the zabbix agent who will query the page.
Save the file, test the Nginx configuration:
sudo nginx -tIf the test is good, reload the Nginx configuration:
sudo systemctl reload nginxNow that Nginx is configured, we will move on to configuring the host in Zabbix.
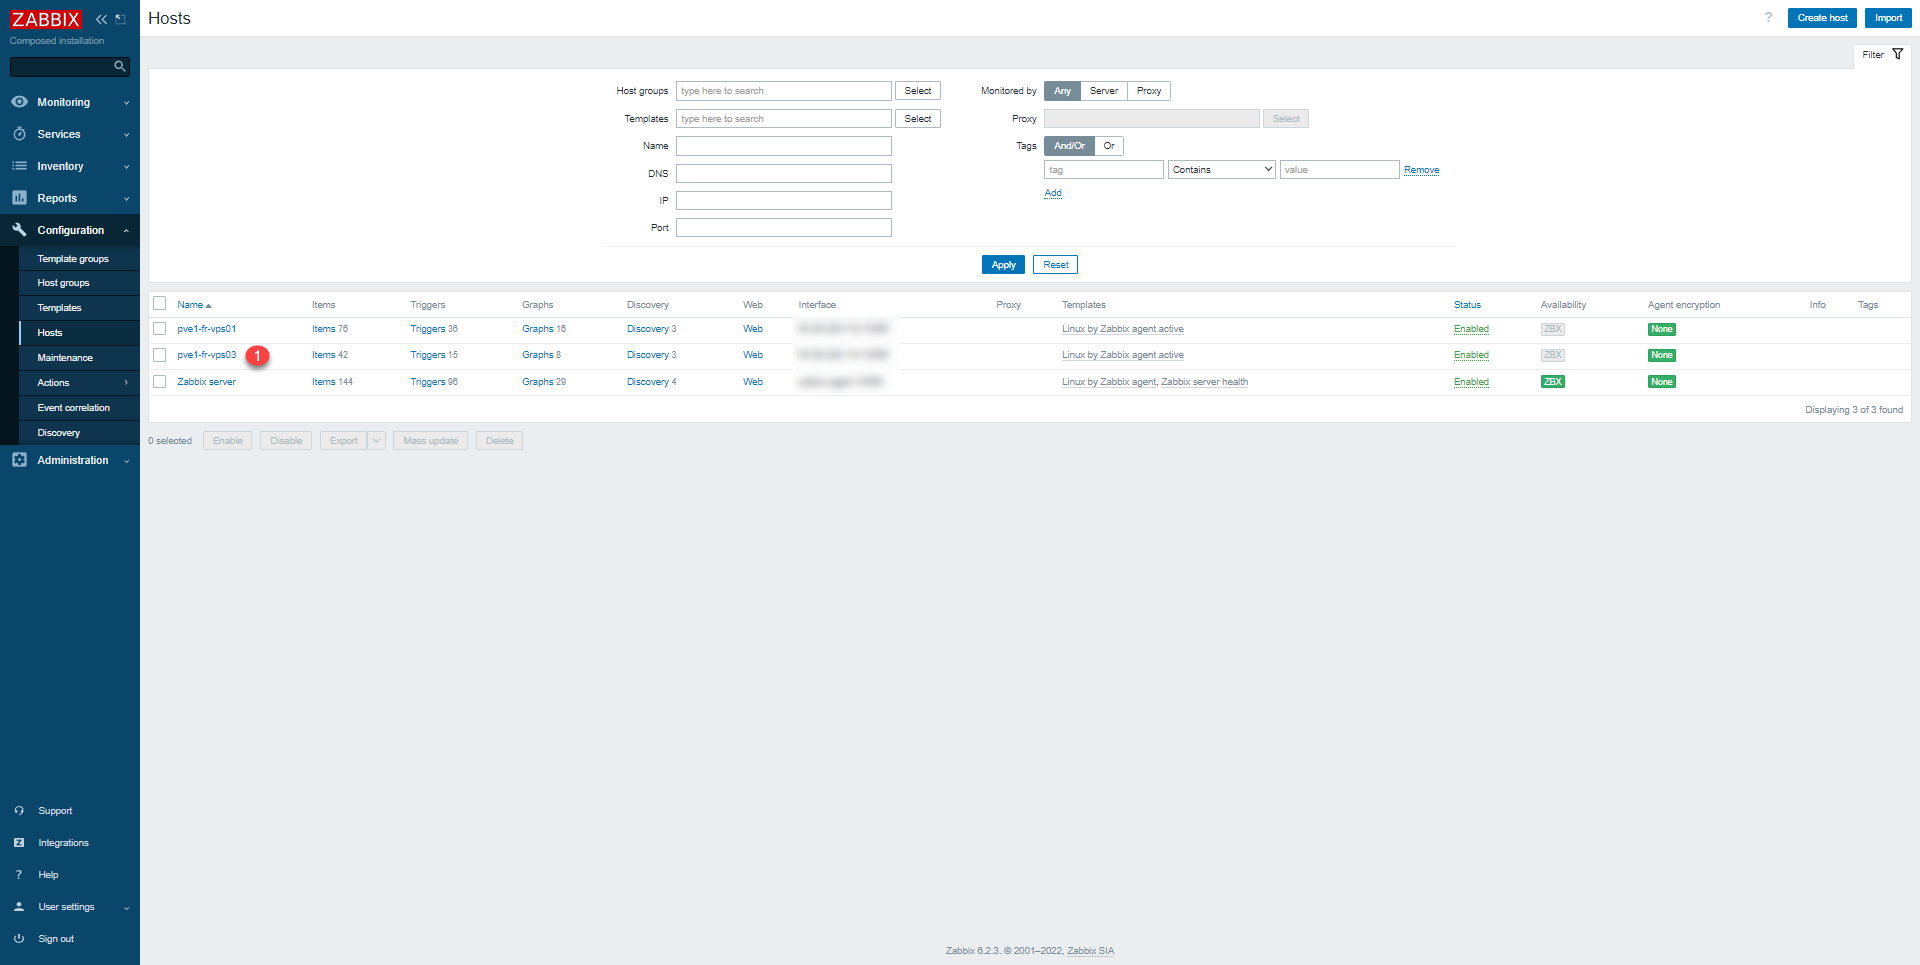
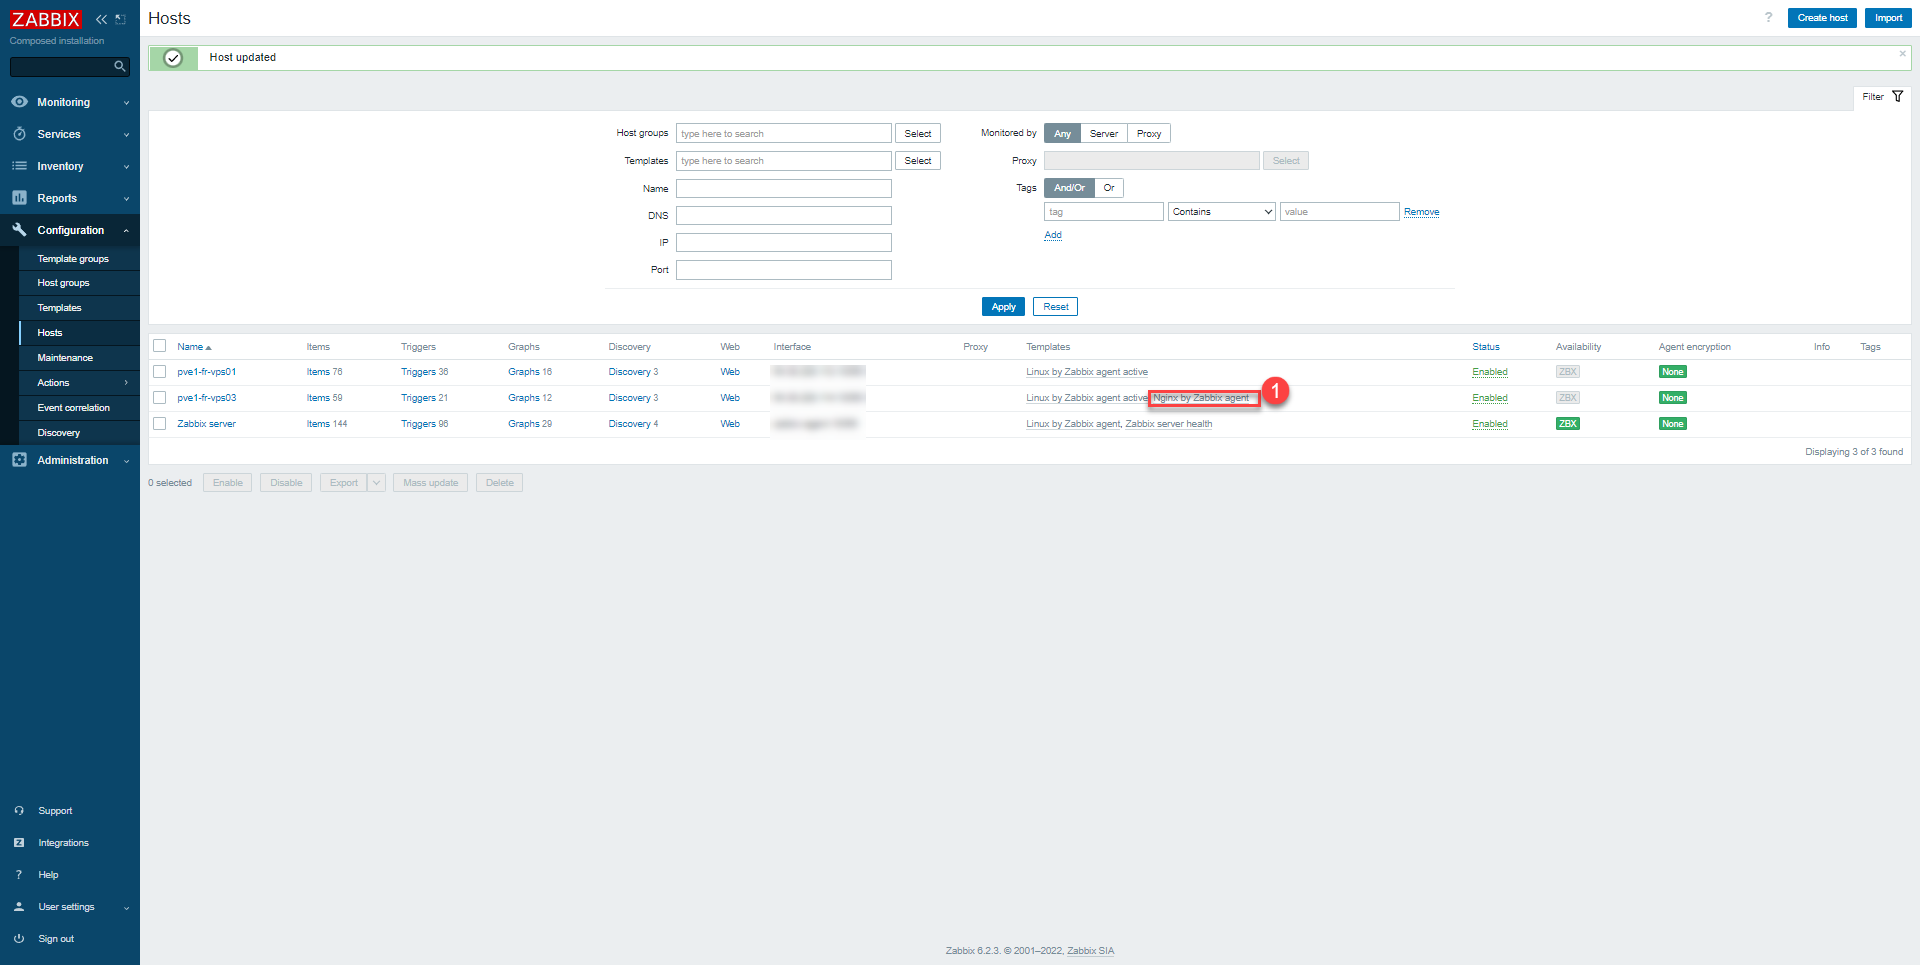
Go to the Configuration 1 list and click on Hosts 2.

Click on host 1 where Nginx is installed to access its configuration.
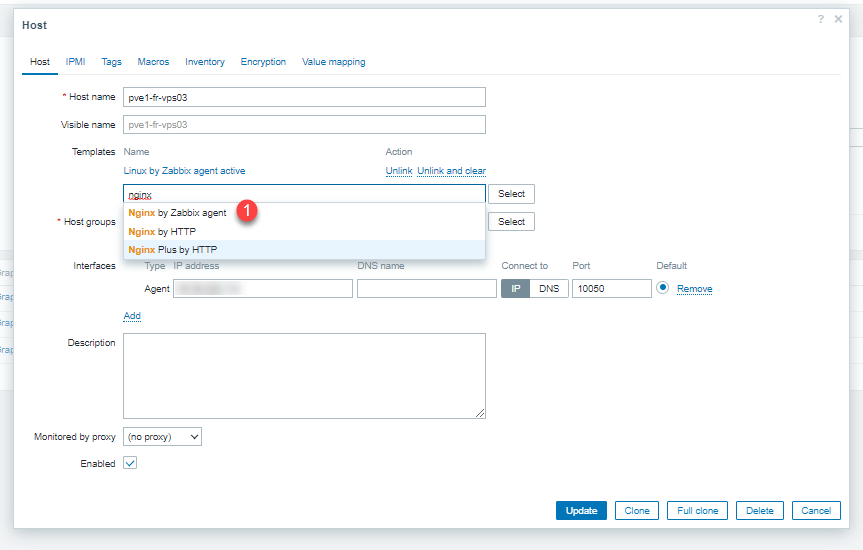
In the templates, search for Nginx by Zabbix agent 1, click on it to add it.
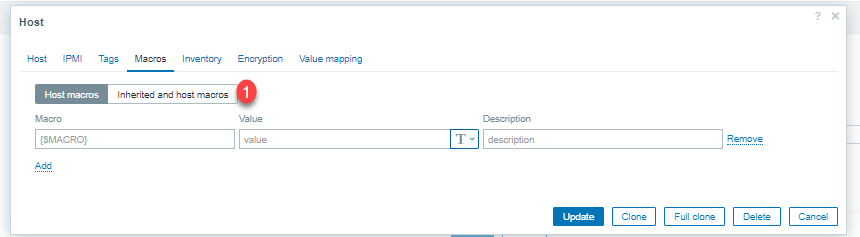
Once the template is selected, click on Macros 1 to configure the statistics access URL.

Then click on Inherited and host macros 1.
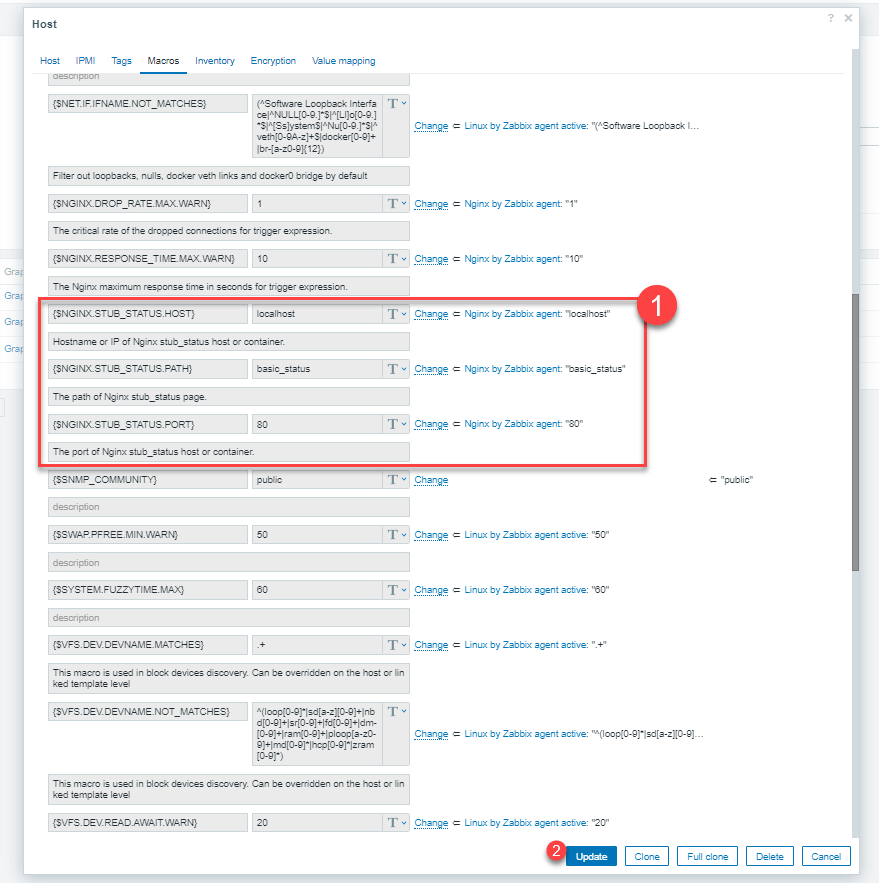
In the list, look for macros related to Nginx 1 and check that they correspond with the server configuration. Once validated, click on the Update button 2 to save.
The template is added 1.
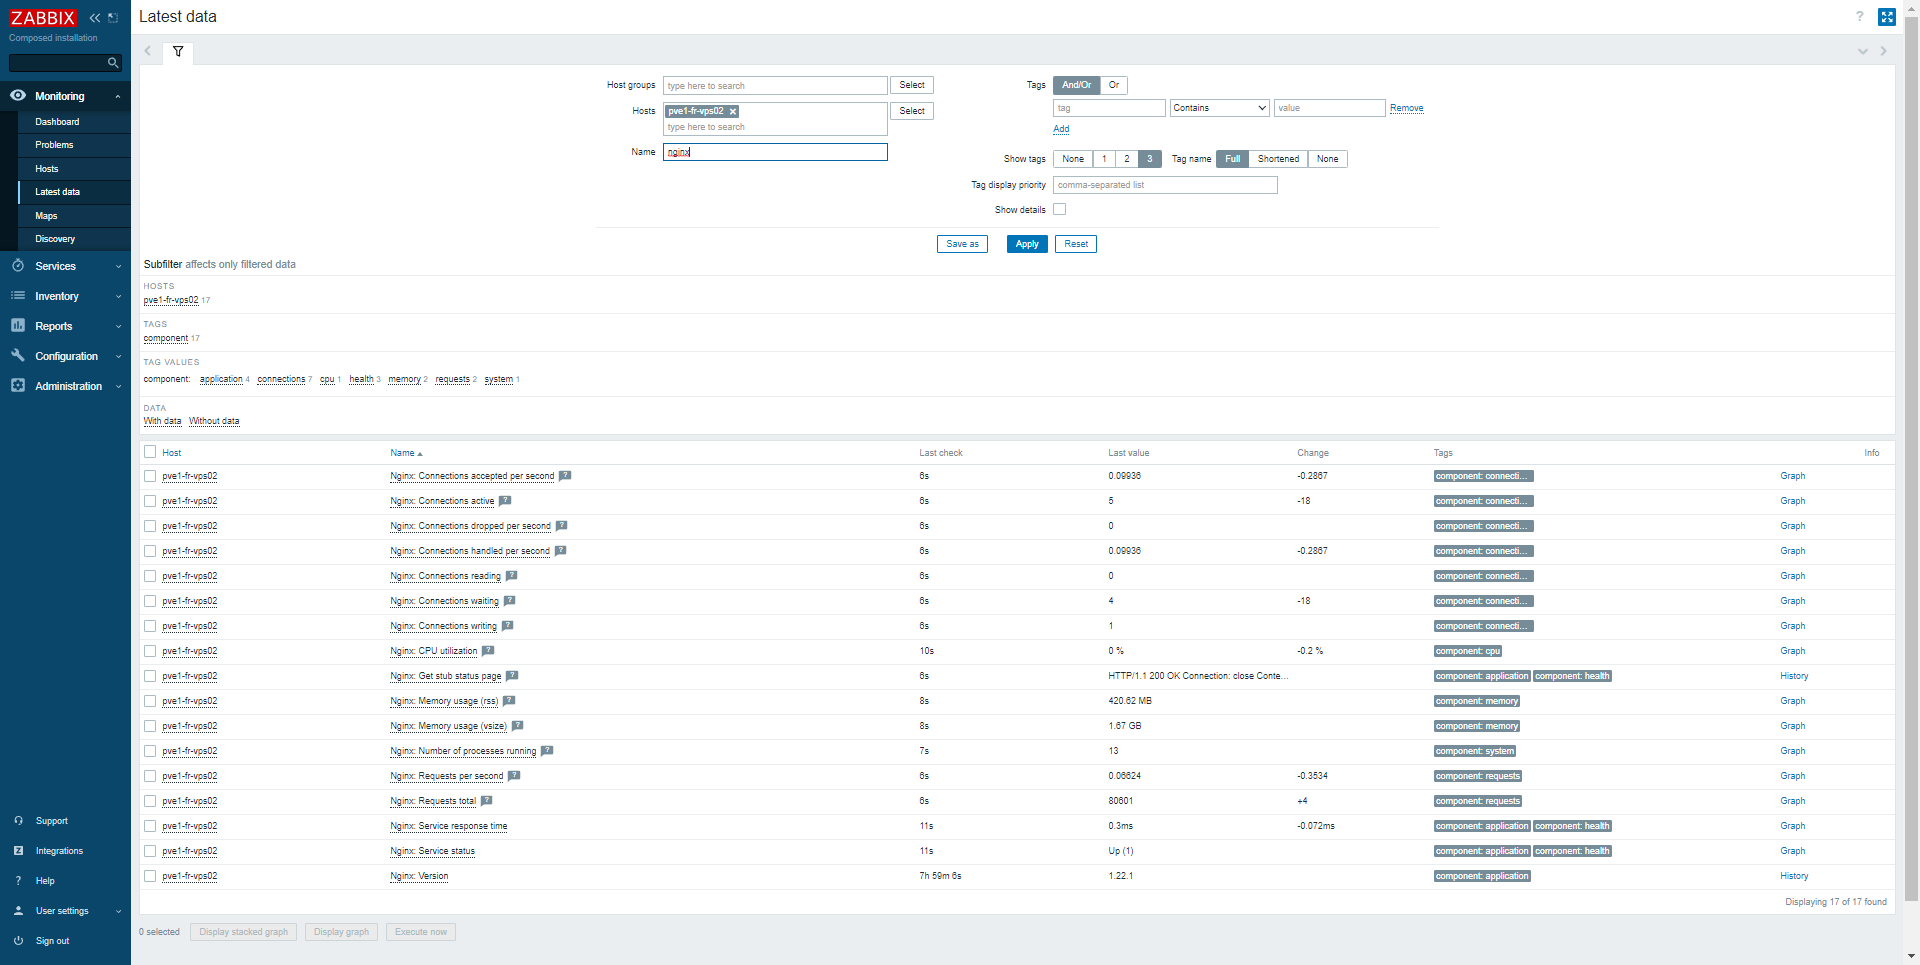
Now that we have configured Nginx monitoring with Zabbix, I will show you the elements you are going to have
Wait 10-15 minutes after adding template to get data in Zabbix
At the element level, there are different performance metrics, such as CPU and RAM usage for example:
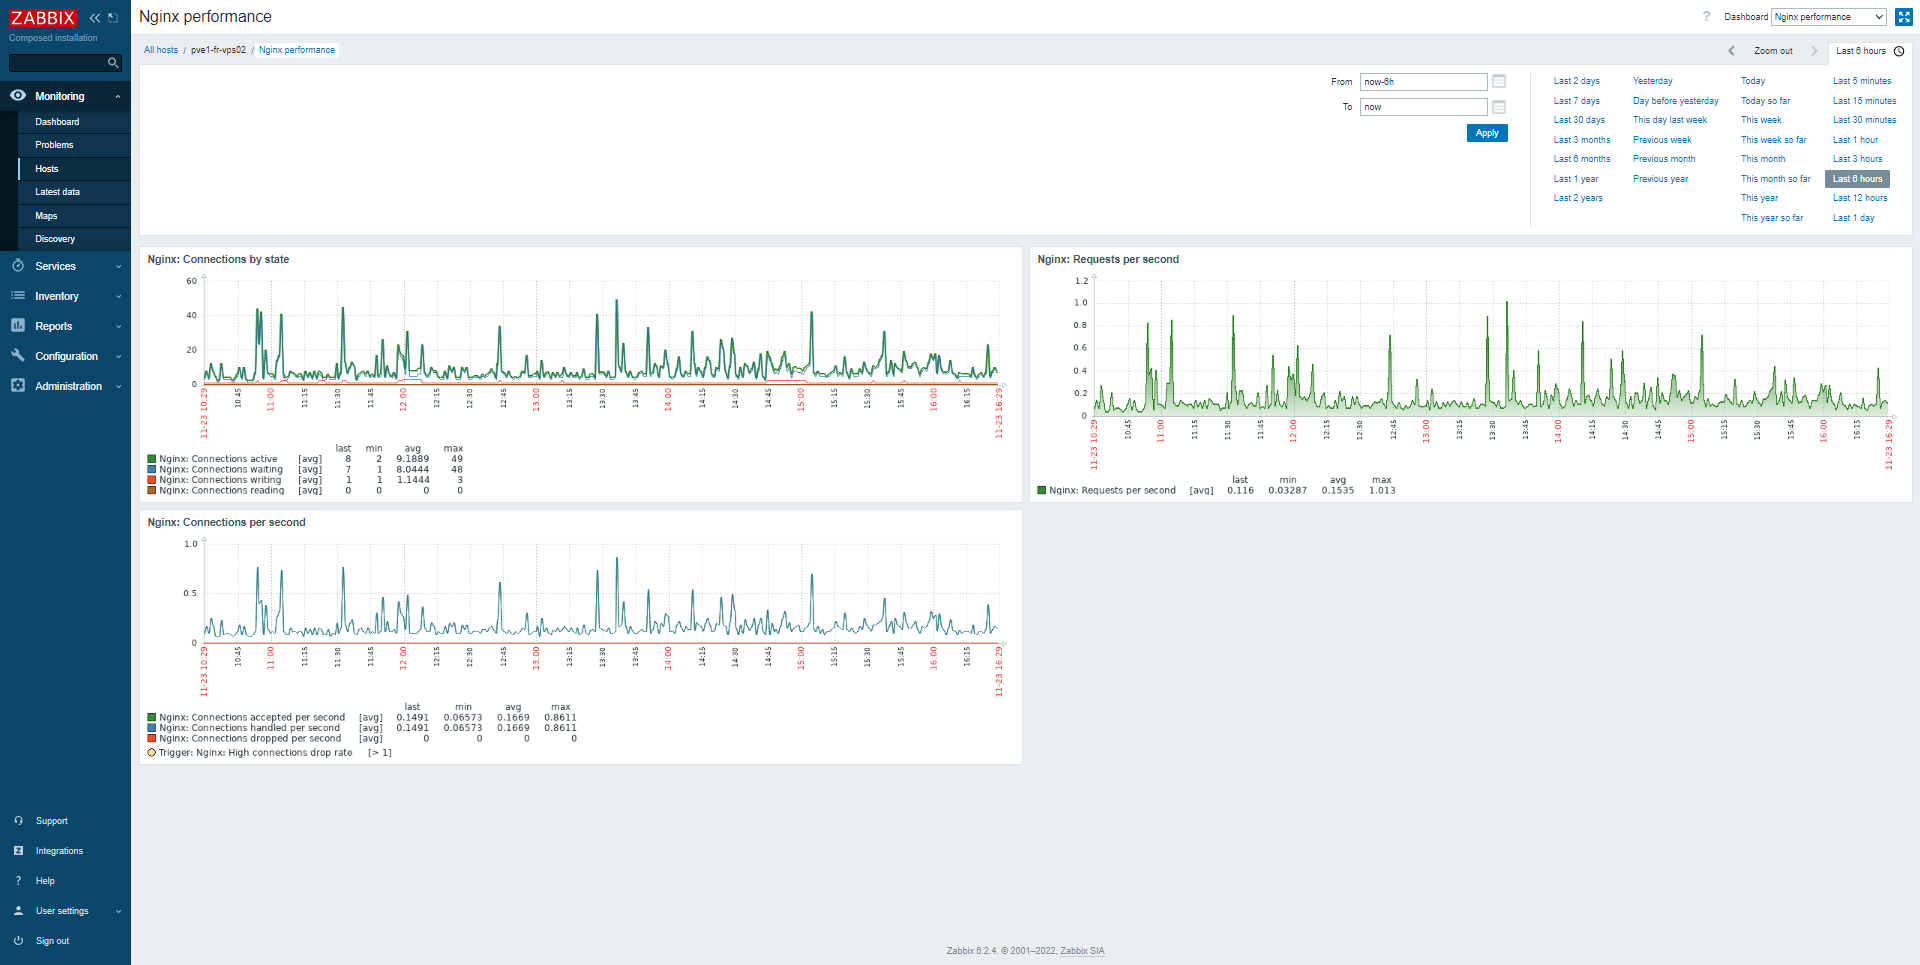
We also have a dashboard (Dashboard) provided with the template which allows you to see the number of connections on the Nginx server.
You now know how to monitor Nginx using Zabbix in order to have performance metrics for your web server.