This script creates a sensor in PRTG that displays the allocation of physical resources to virtual machines.
Scripts can be used to monitor a standalone / clustered Hyper-V host and / or cluster.
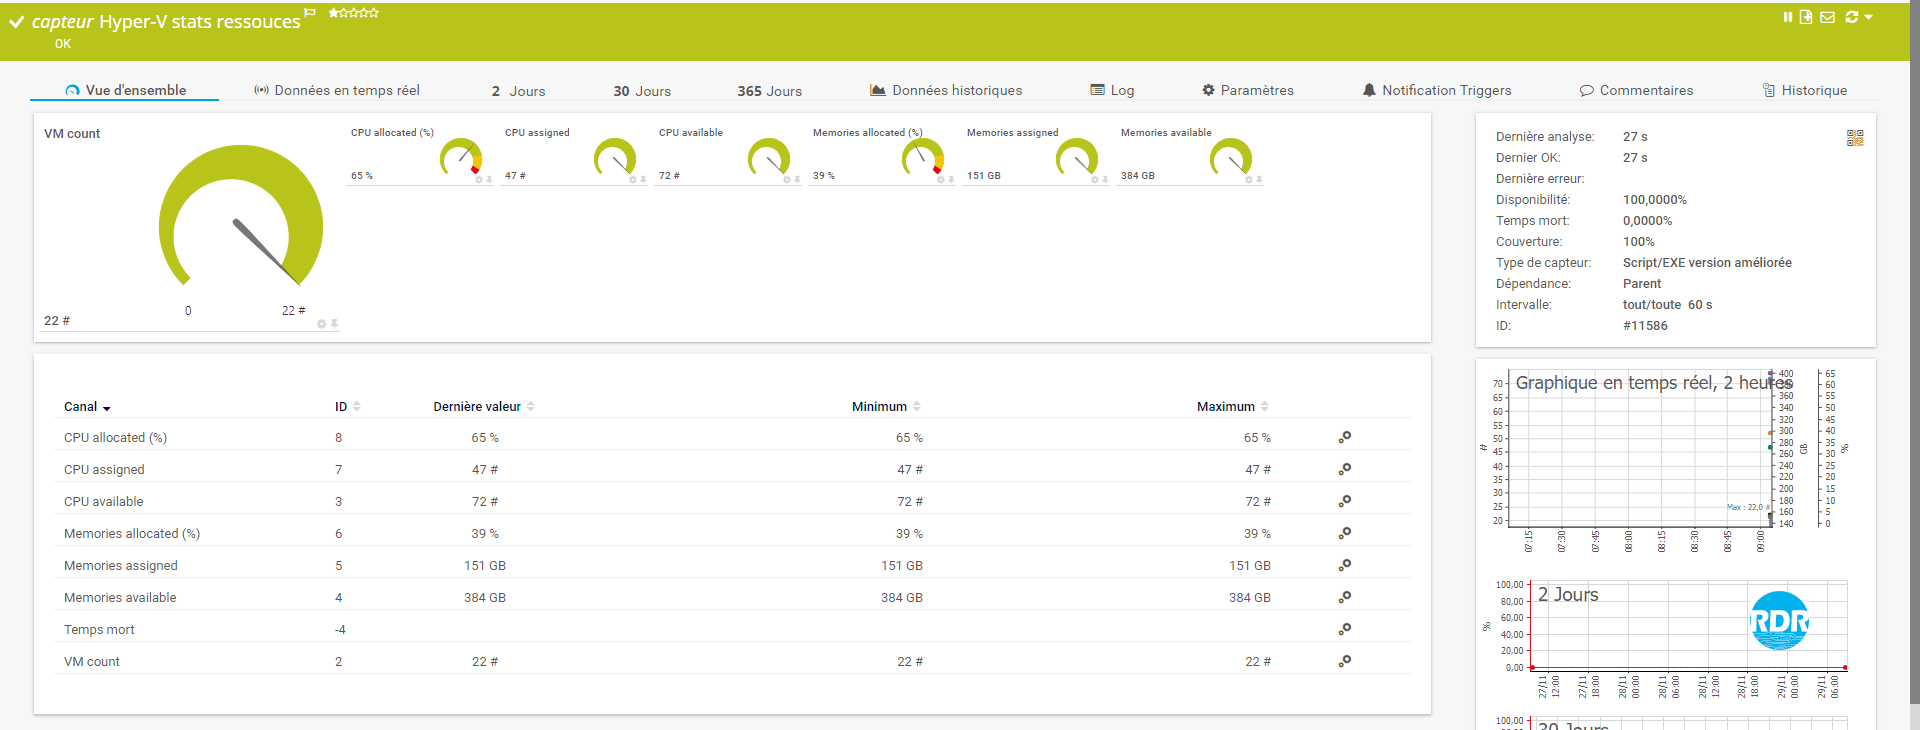
Canals :
- VM Count : number of virtual machines
- CPU allocated (%) : percentage of logical CPUs allocated to VMs.
- CPU assigned : number of CPUs assigned to the VMs.
- CPU available : total number of CPUs available.
- Memories allocated (%) : percentage of memory allocated to VMs.
- Memories assigned : amount of memory assigned to the VMs.
- Memories available : amount of memory available.
- Node count (cluster) : number of nodes in the Hyper-V cluster.
The memory % memory alert on a cluster is calculated to tolerate the loss of a node.
- for 2 servers: 50%
- for 3 servers: 66%
- for 4 servers: 75%
- …

Installation
1. Unzip the downloaded archive.
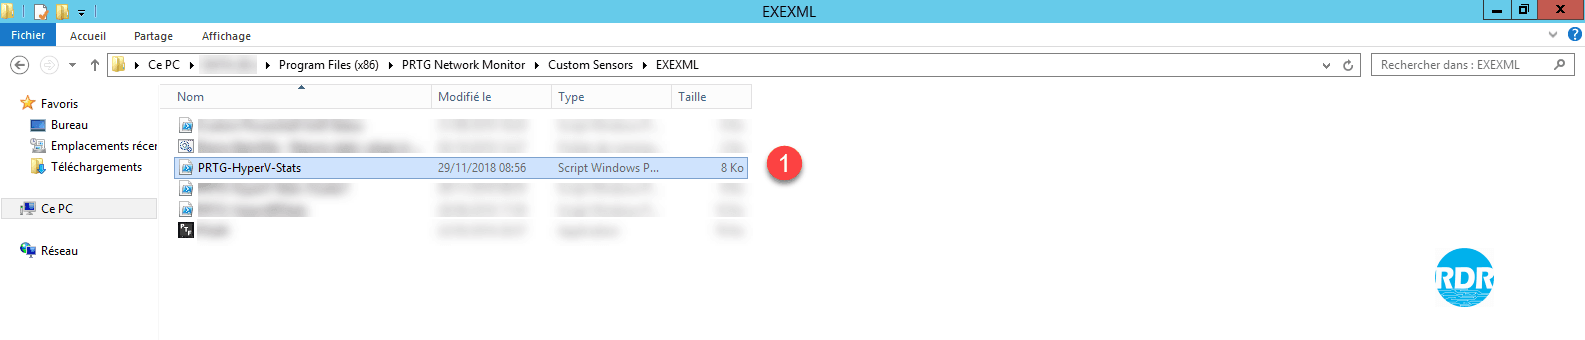
2. Copy file PRTG-HyperV-Stats.ps1 1 in the folder C:\Program Files (x86)\PRTG Network Monitor\Custom Sensors\EXEXML
Configuration for a Hyper-V host
Prerequisites:
- Hyper-V Management PowerShell command installed on the PRTG server.
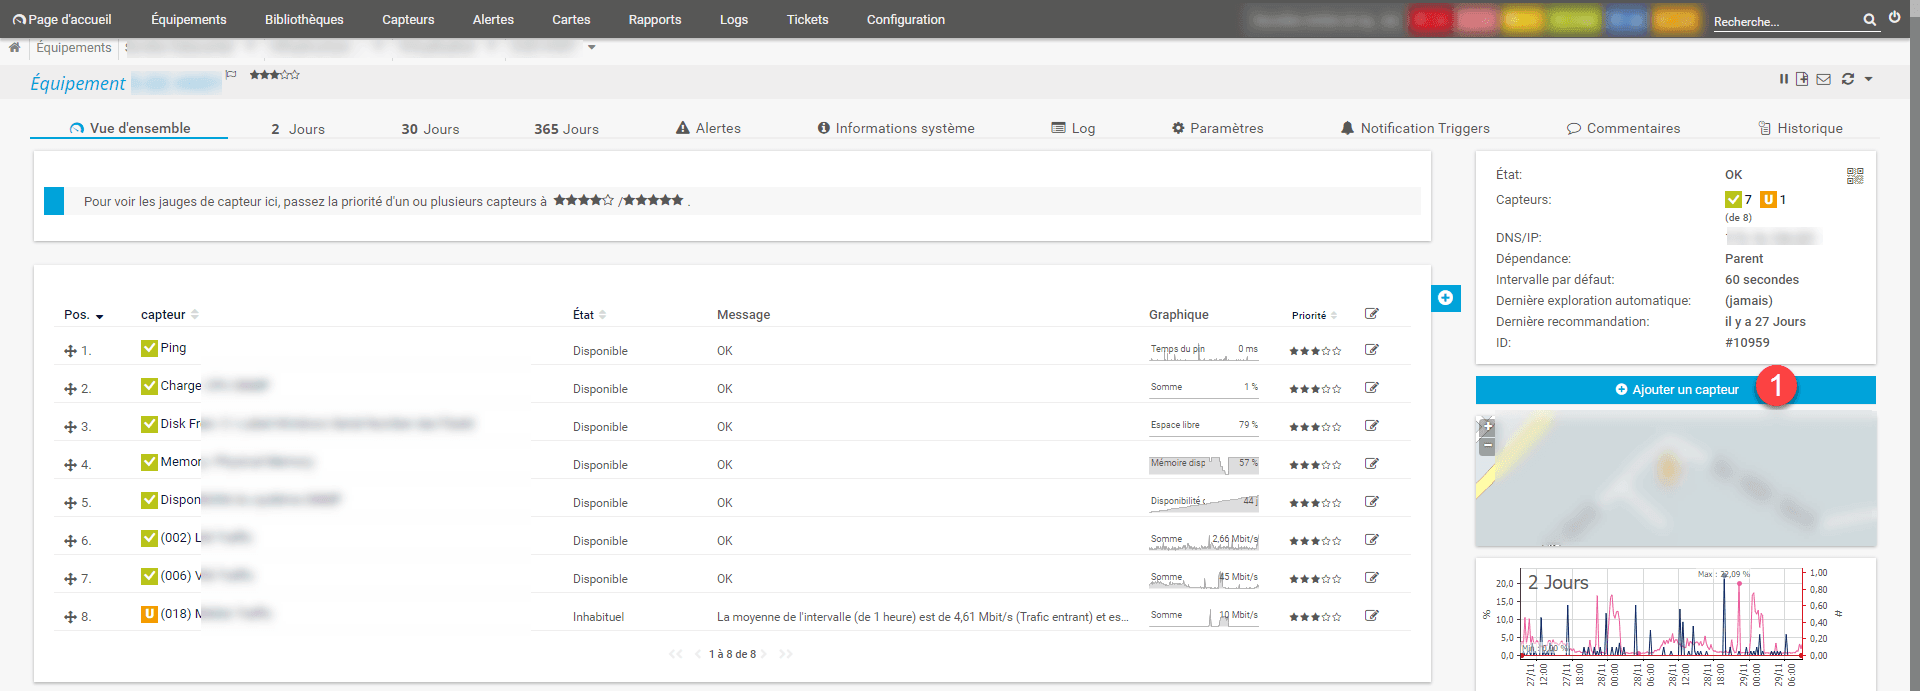
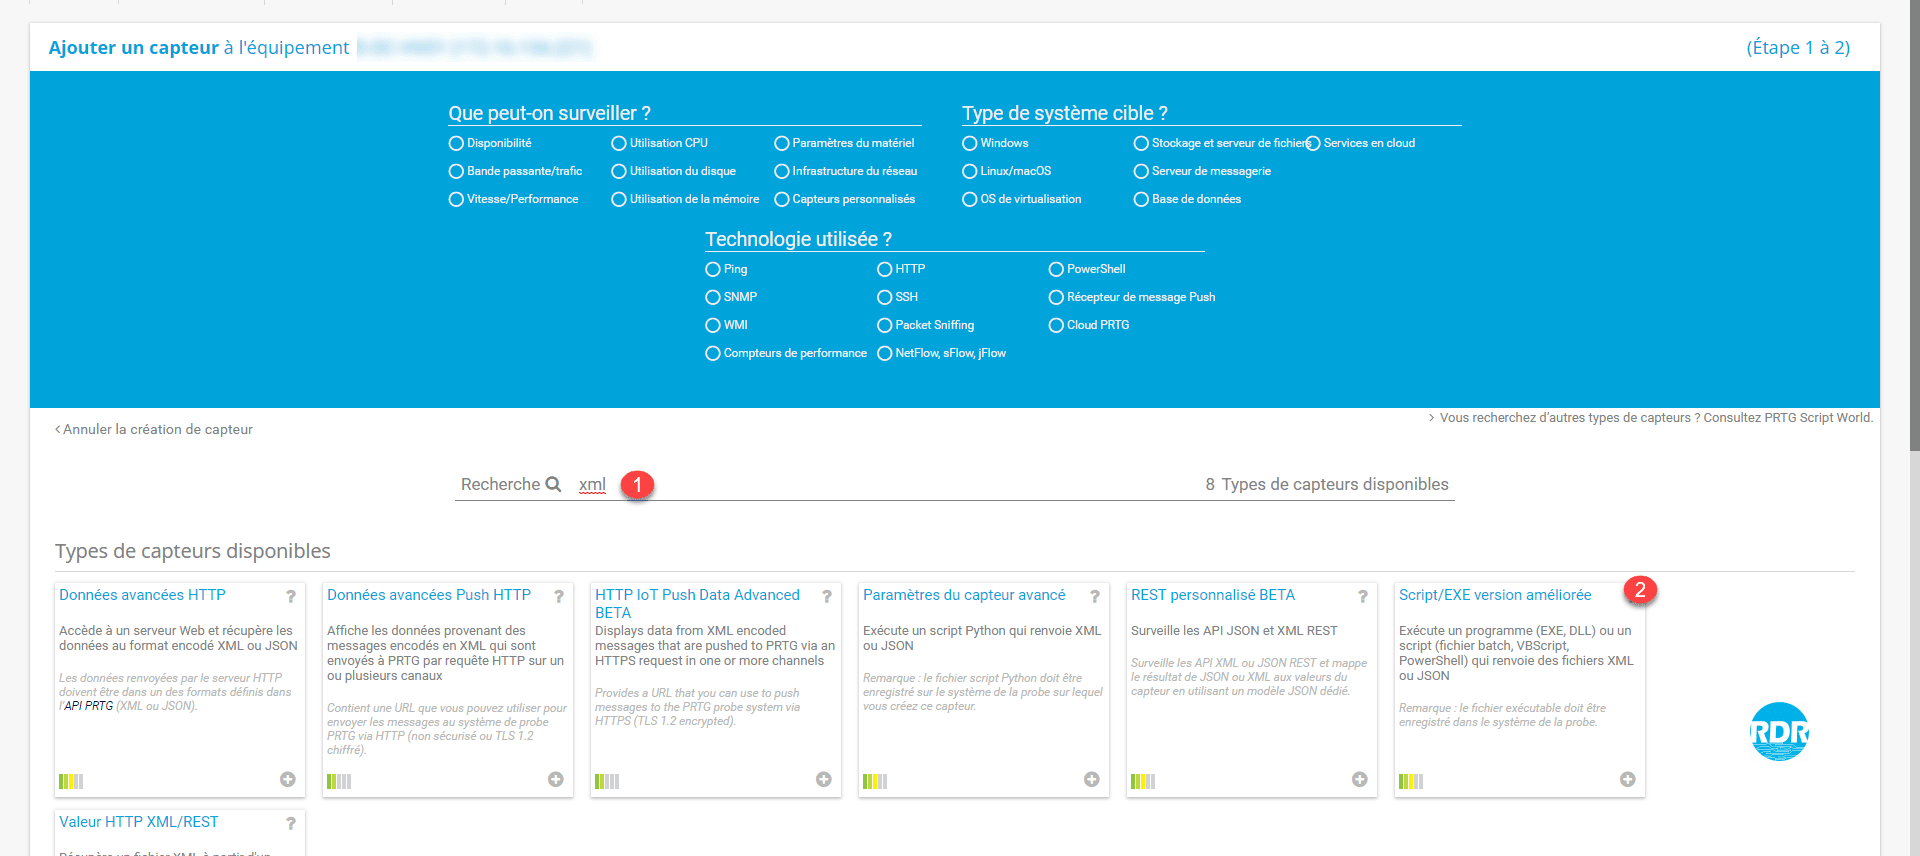
1. From the web interface or the PRTG console, go to the host you want to monitor and click Add sensor 1.
2. In the search box between xml 1 and click on the sensor Script/EXE improved version 2 .
3. Name the sensor 1 , in Scripts / EXE select the file PRTG-HyperV-Stats.ps1 2 , enter the parameters 3 , choose Use Windows access data of the parent devices < <4 and click on Create 5 .
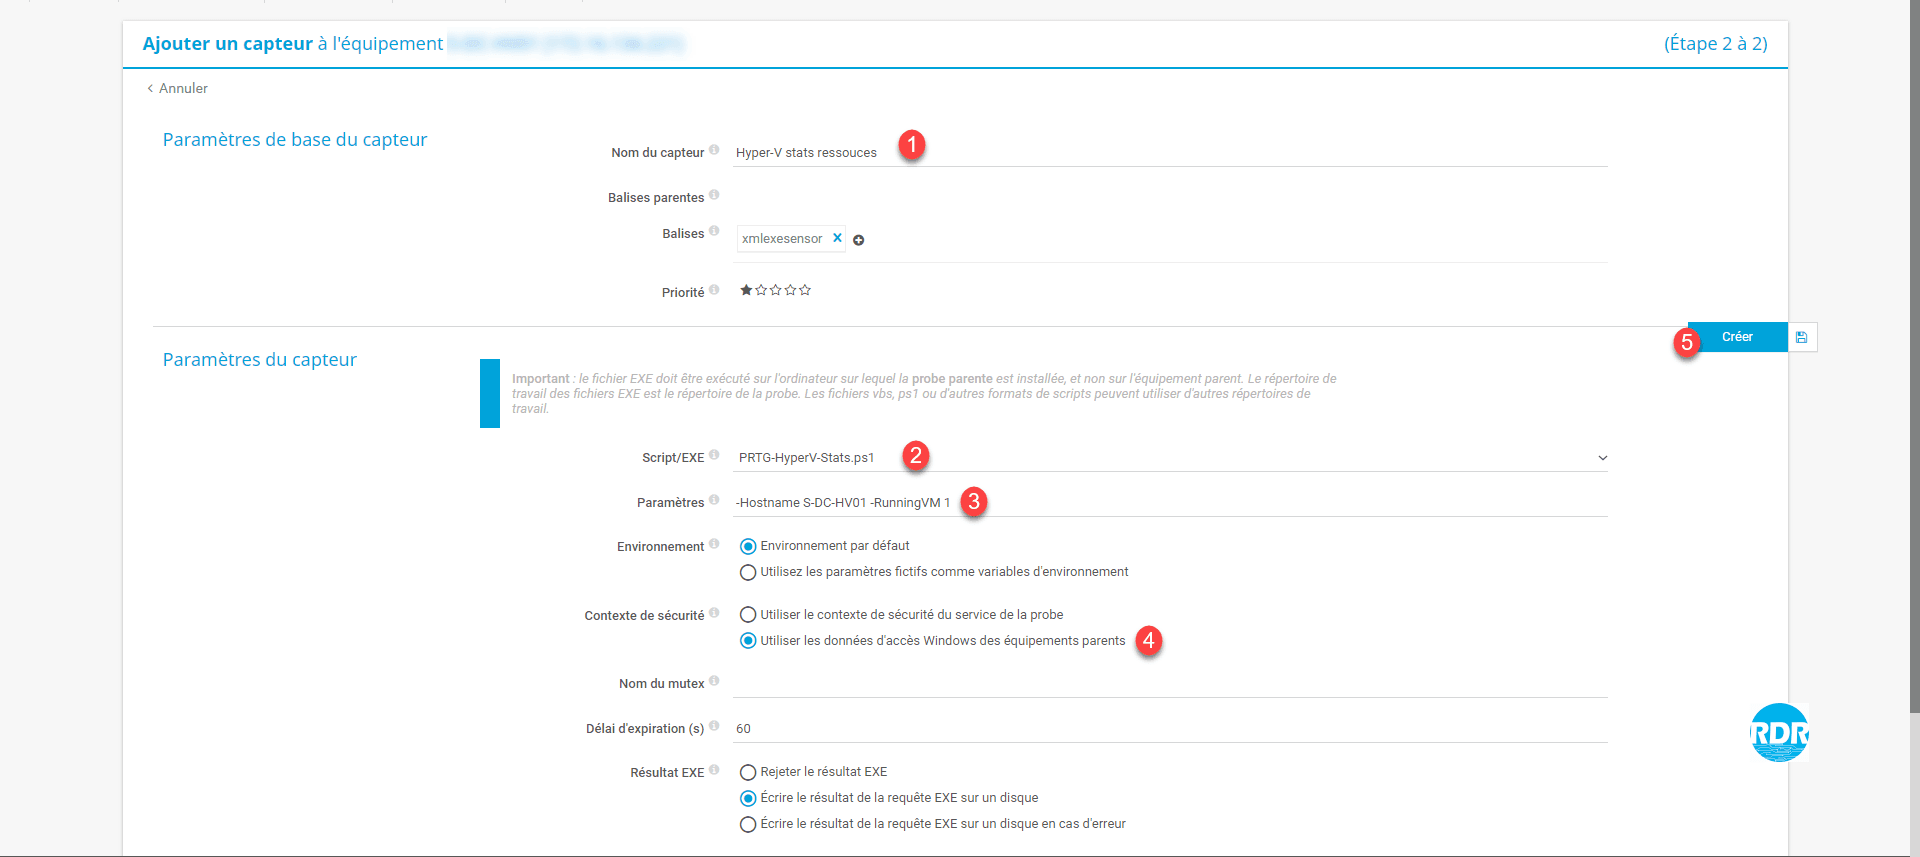
Settings :
- -Hostname <!NAME_OF_SERVER_HYPER_V!>
- -RunningVM 0|1 : determines if the script only scans the powered on virtual machines
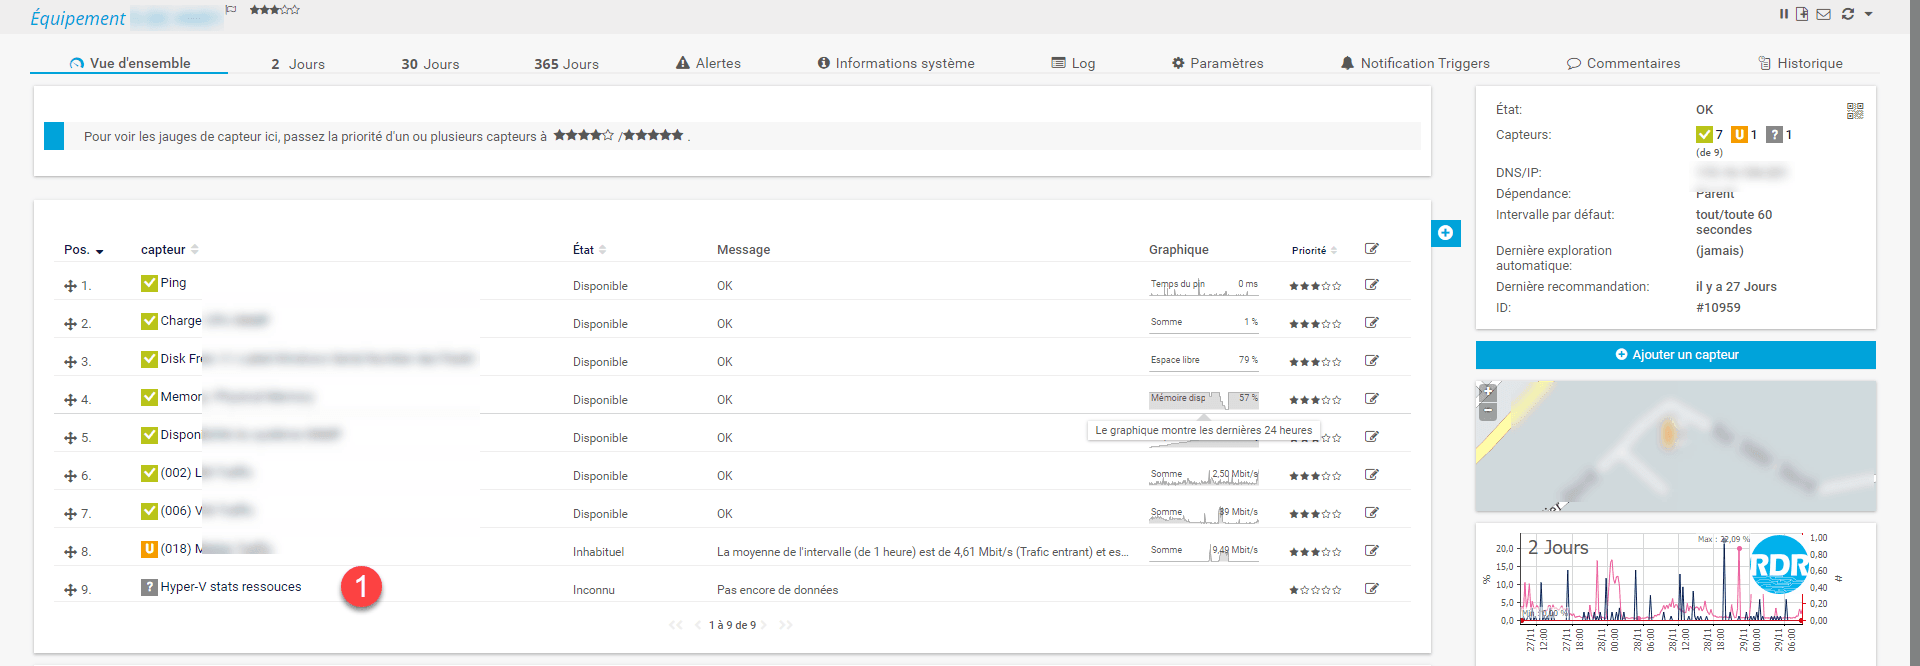
4. The sensor is added, click on 1 .
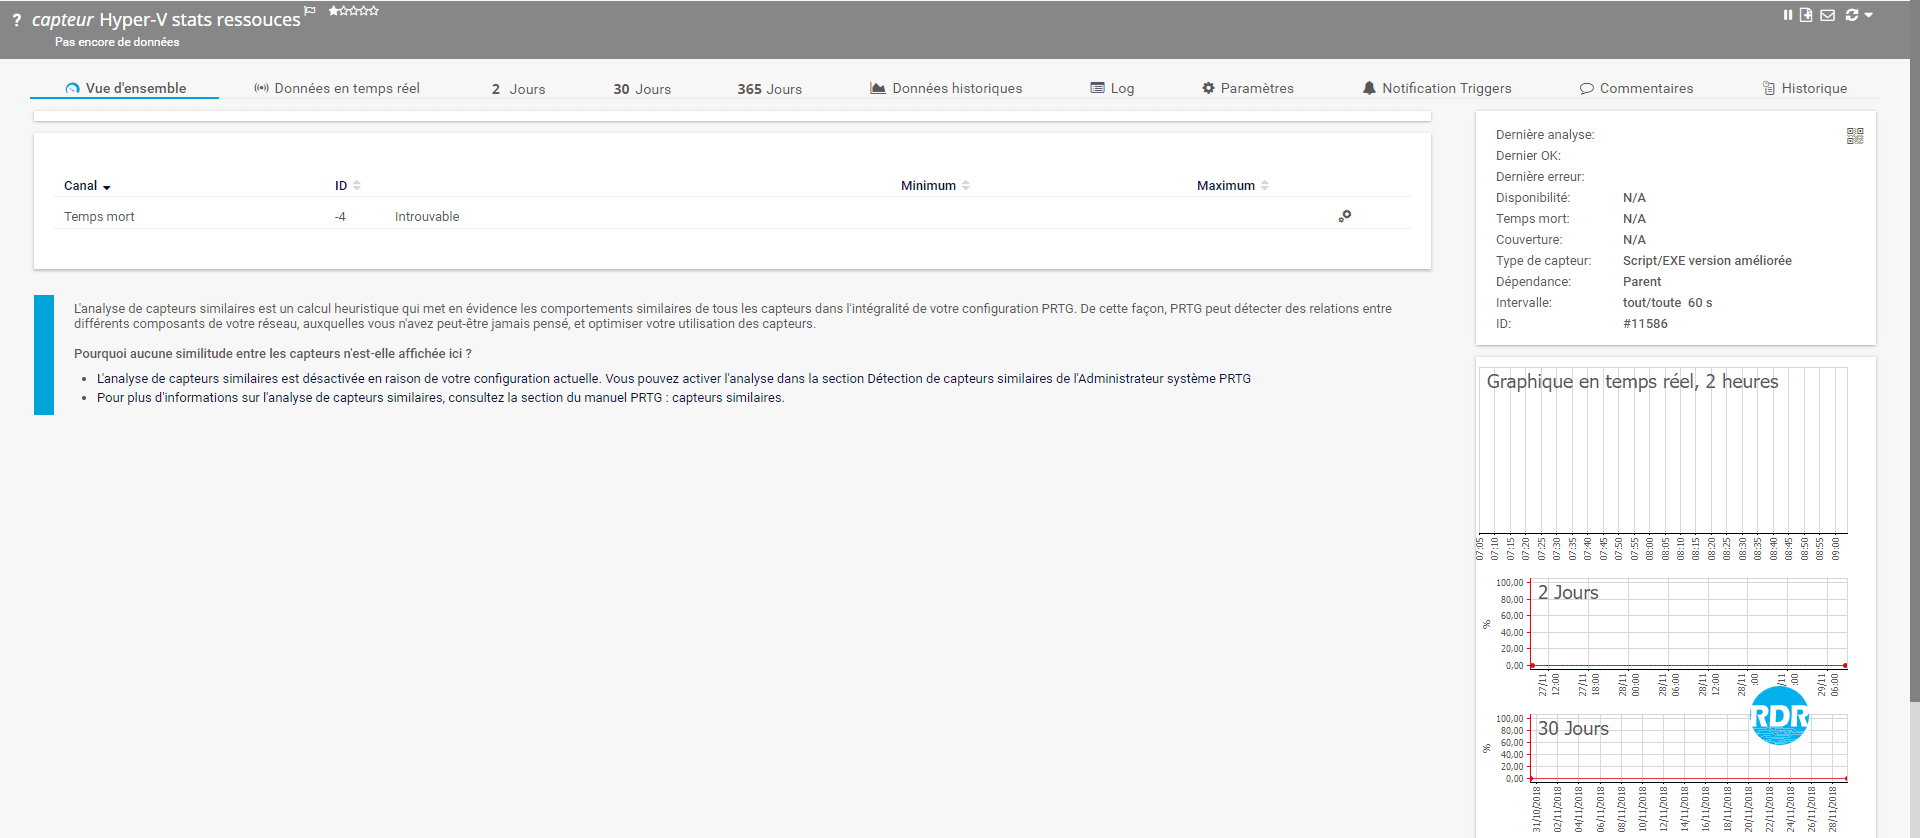
5. Wait while PRTG launches the first analysis …
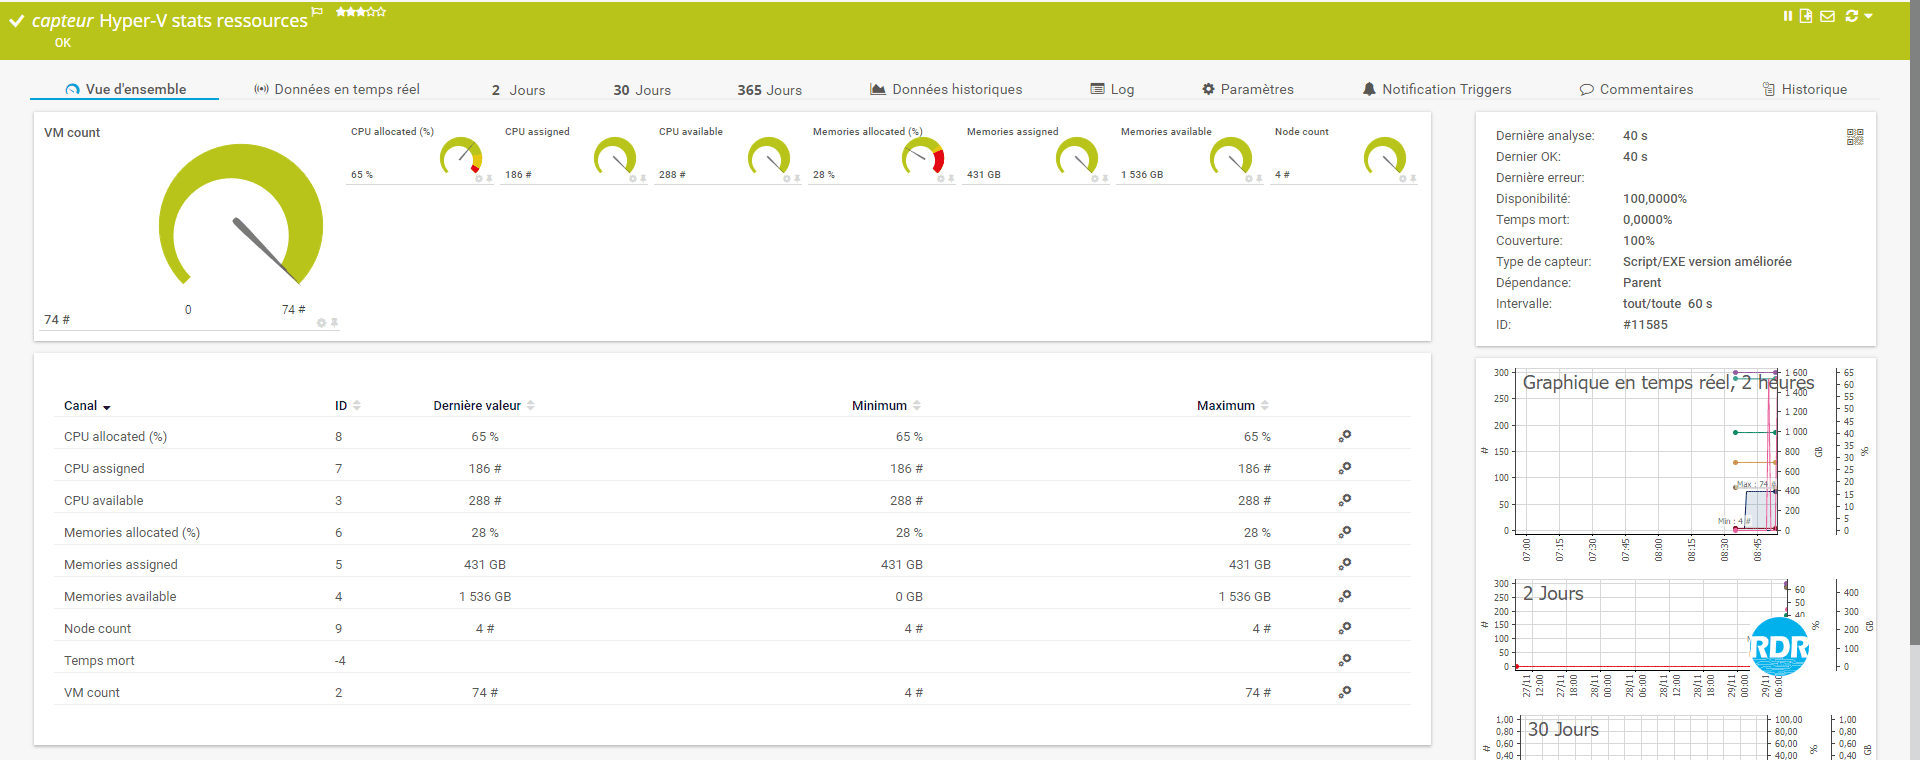
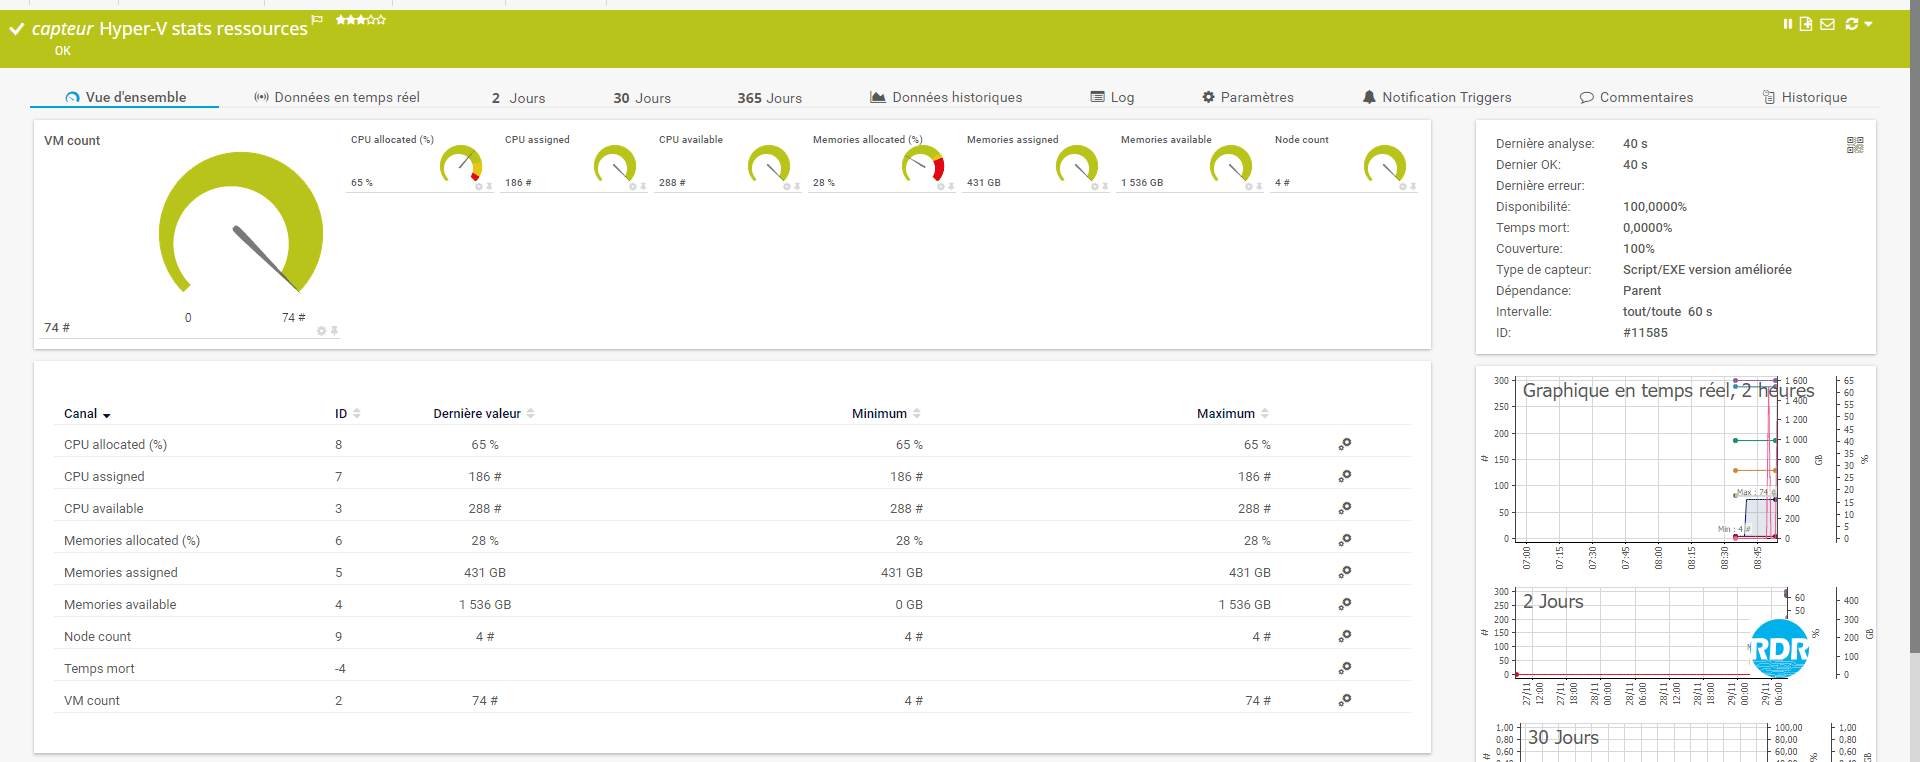
6. Result of analyzing the allocation of resources on a Hyper-V host.
Installation and configuration for a Hyper-V cluster
Prerequisites:
- Hyper-V Management PowerShell command installed on the PRTG server.
- PowerShell cluster management command installed on the PRTG server.
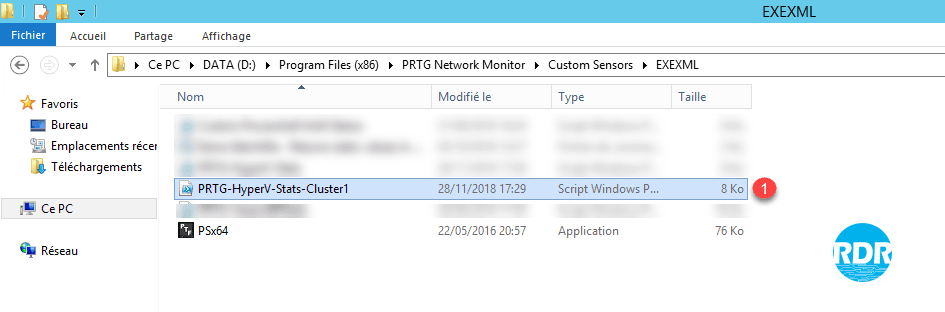
- PSx64.exe to install in the C:\Program Files (x86)\PRTG Network Monitor\Custom Sensors\EXEXML
1. Go to the folder C:\Program Files (x86)\PRTG Network Monitor\Custom Sensors\EXEXML and make a copy of the file PRTG-HyperV-Stats.ps1 (example: PRTG-HyperV-Stats_CLUSTERNAME.ps1) 1.
2. Edit the file modifying the following variables:
- [bool]$IsCluster = $True
- [string]$HostName = “DNS-NAME-CLUSTER”
3. From the web interface or the PRTG console, go to the host you want to monitor and click Add sensor 1>.
4. In the search box between xml 1 and click on the sensor Script/EXE improved version 2 .
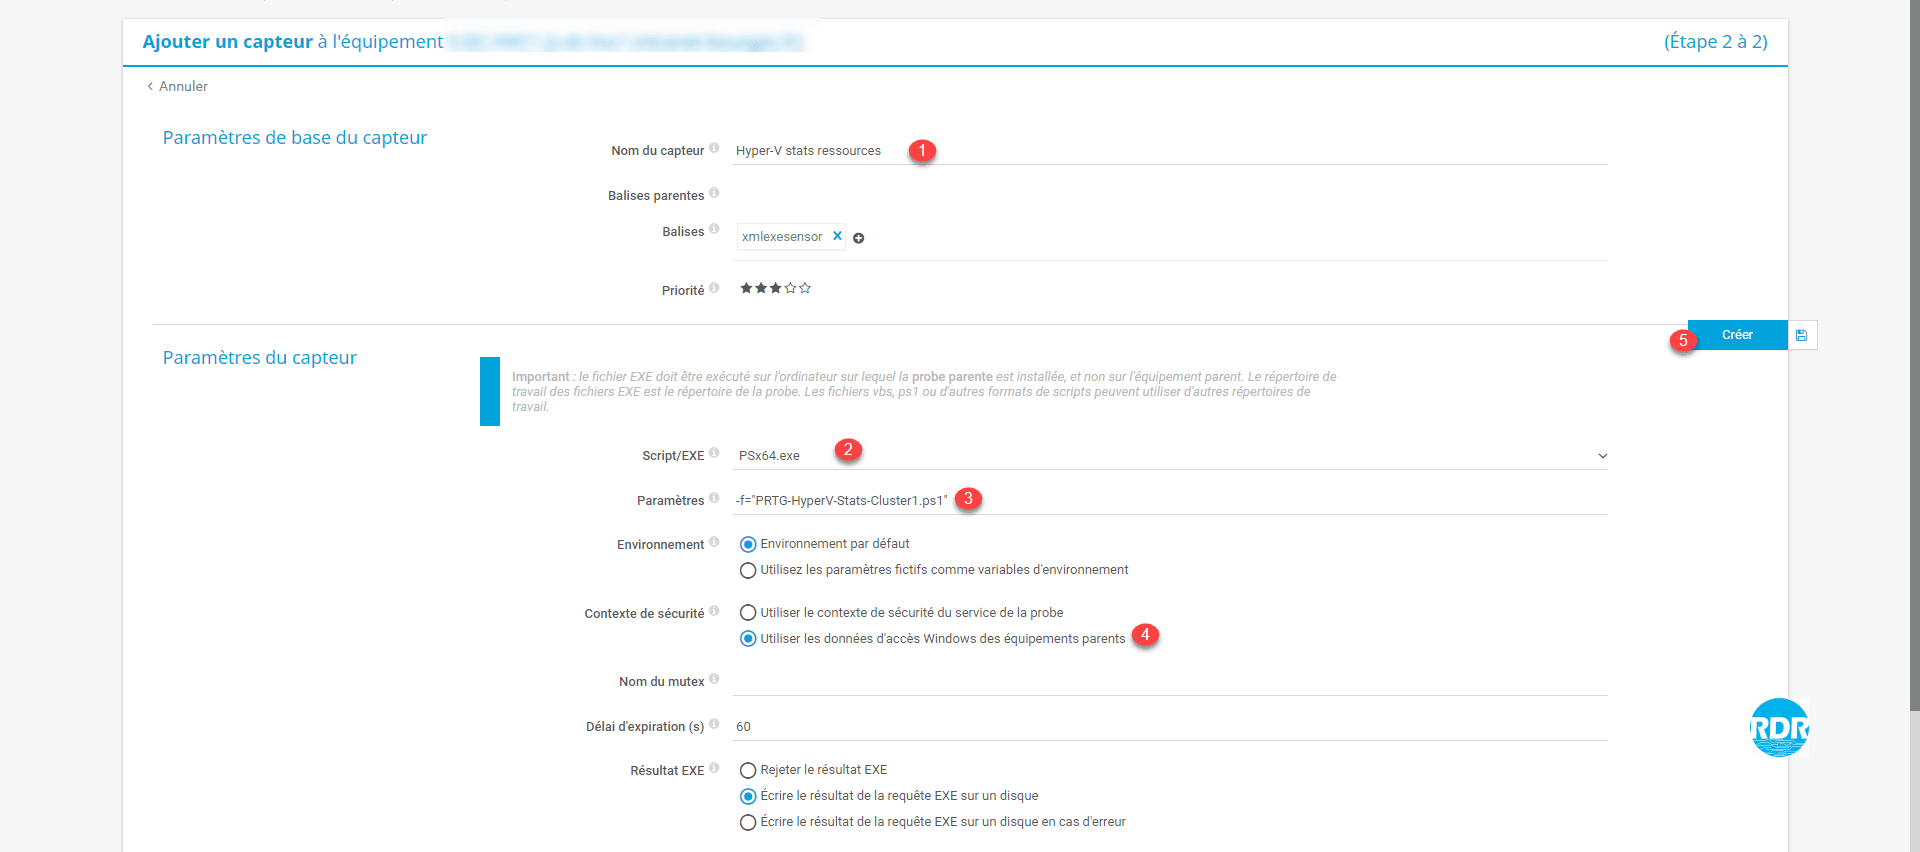
5. Name the sensor 1 , in Scripts/EXE select the file PSx64.exe 2 , enter the parameters -f=”PRTG-HyperV-Stats_CLUSTERNAME.ps1″ 3 , choose Use data Windows access of parent devices 4 and click on Create 5 .
6. The sensor is added, click on 1 .
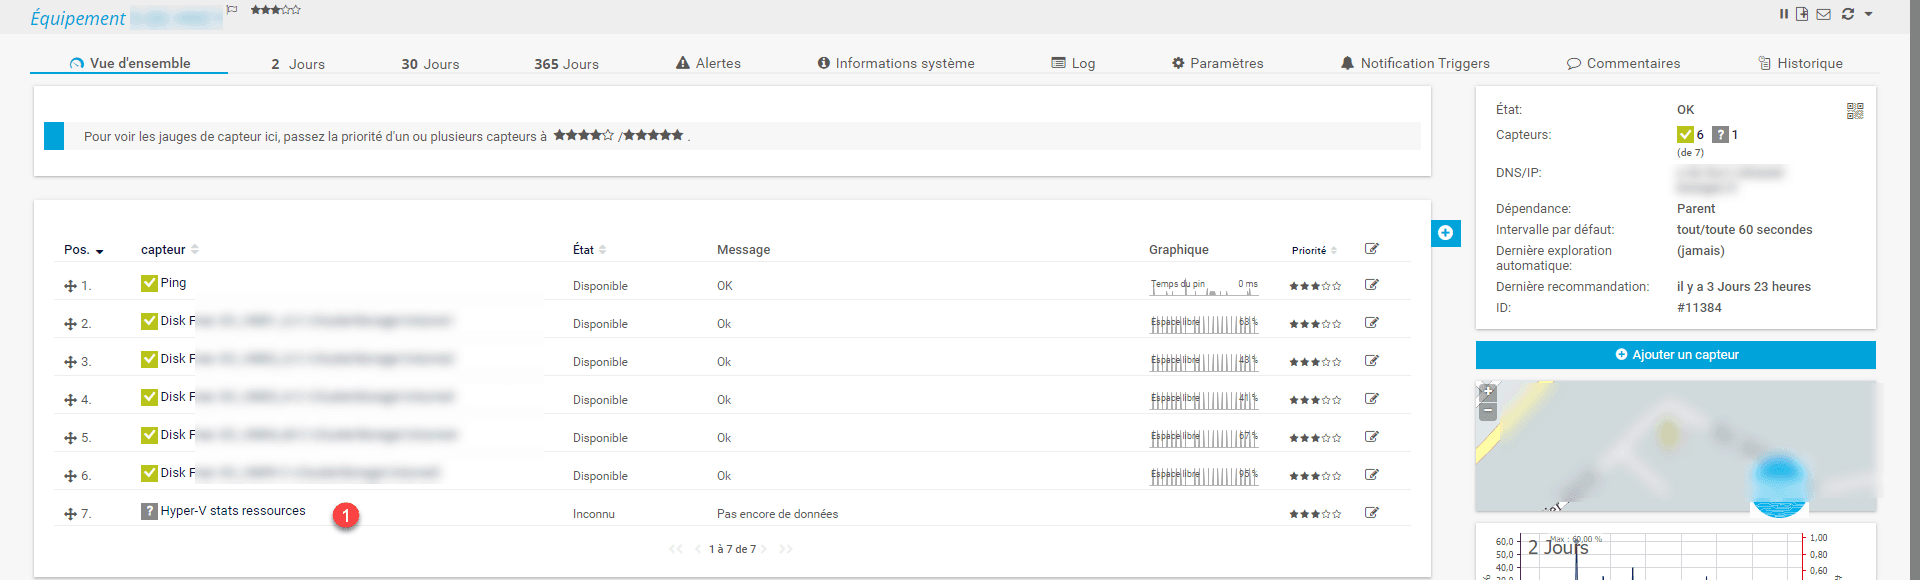
7. Wait while PRTG launches the first analysis …
8. Result of analysis of the allocation of resources on a Hyper-V cluster.