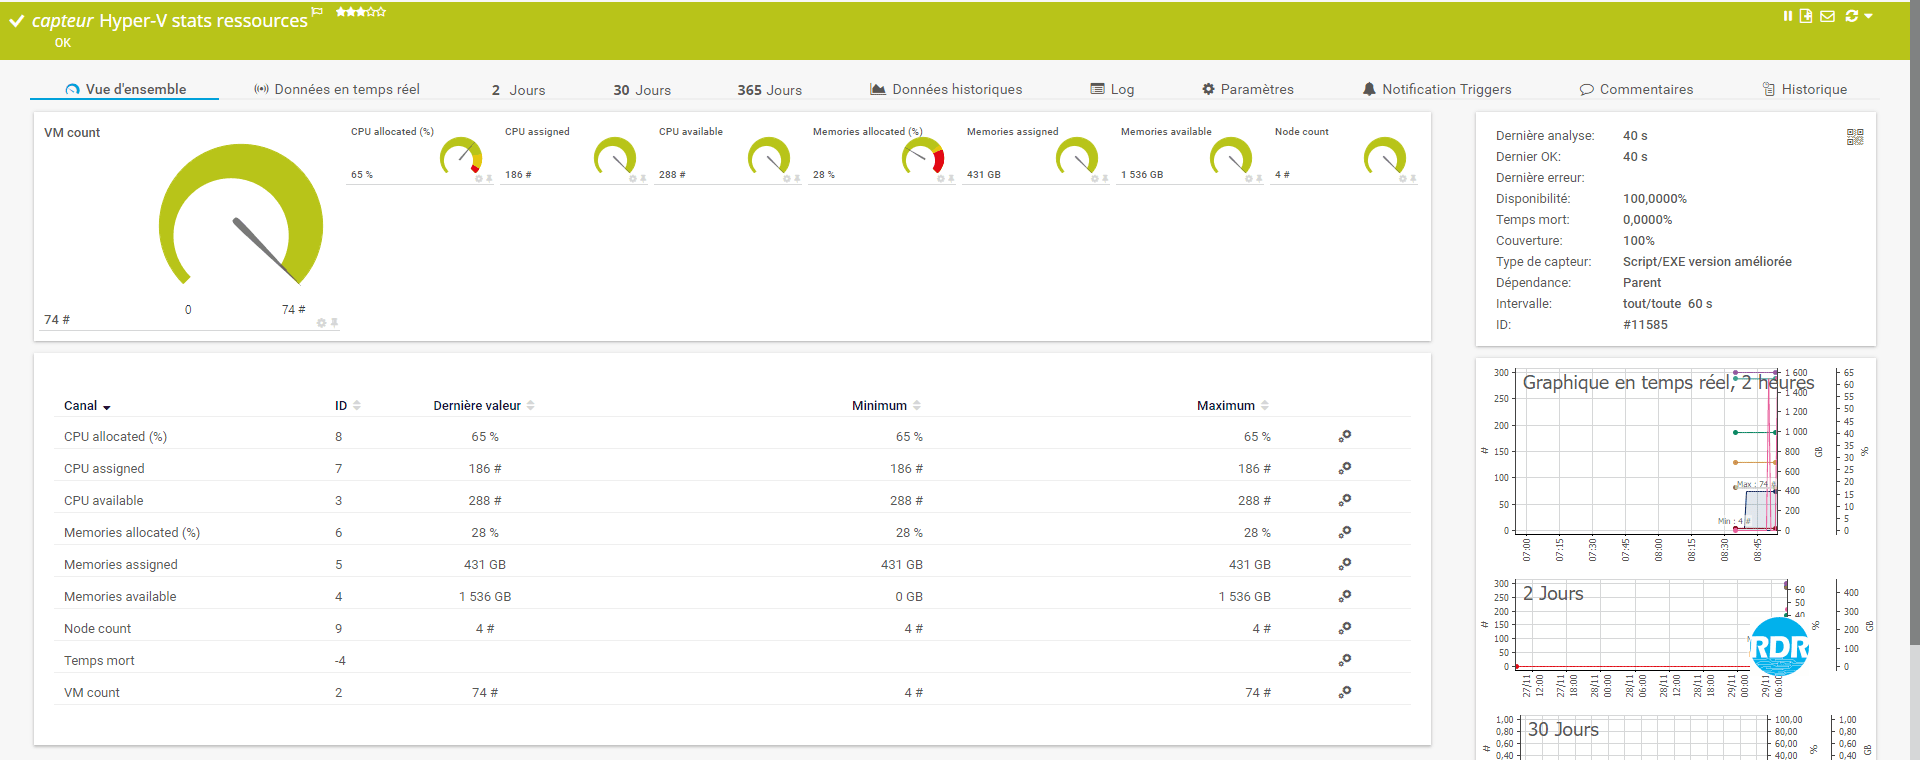
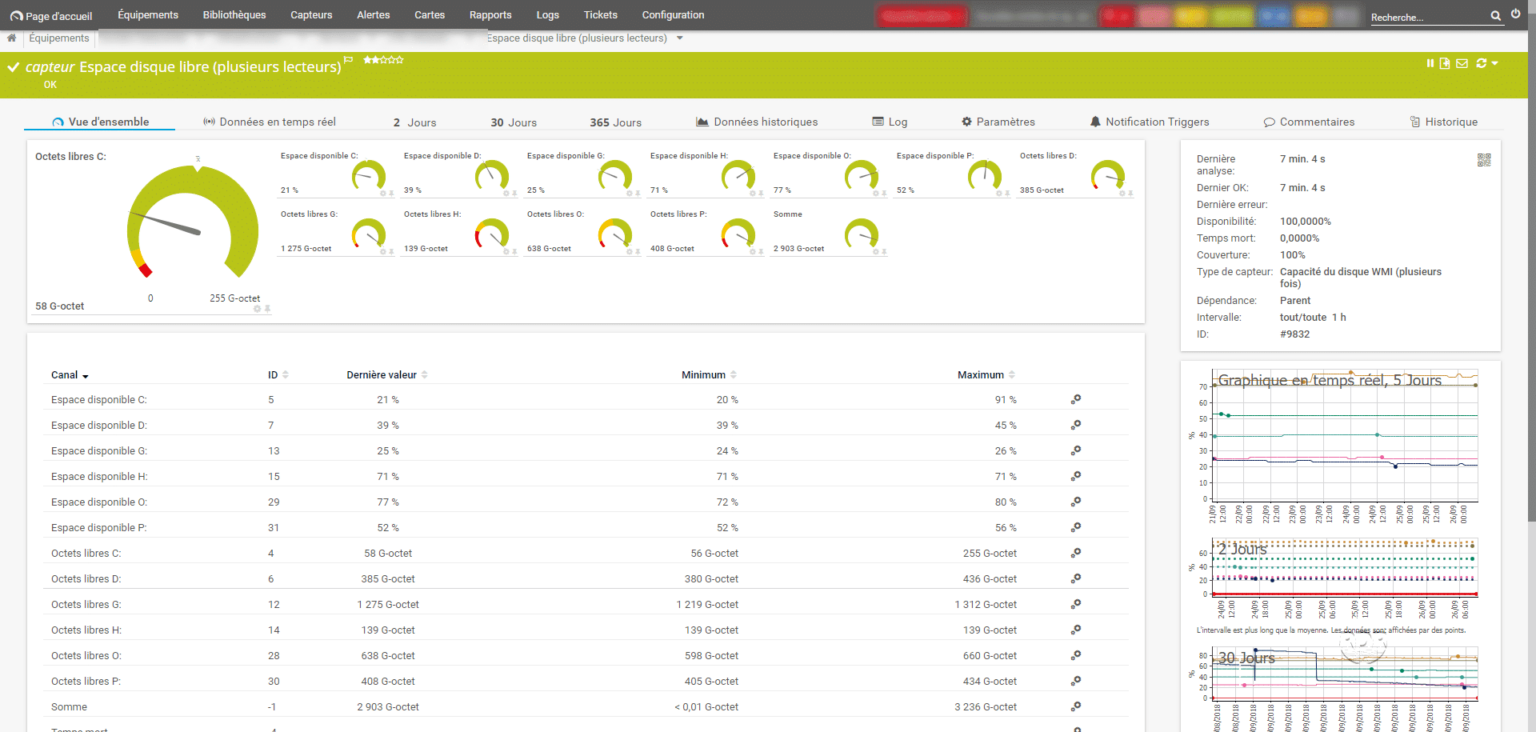
This script creates a sensor in PRTG that displays the allocation of physical resources to virtual machines.
Scripts can be used to monitor a standalone / clustered Hyper-V host and / or cluster.
Canals :
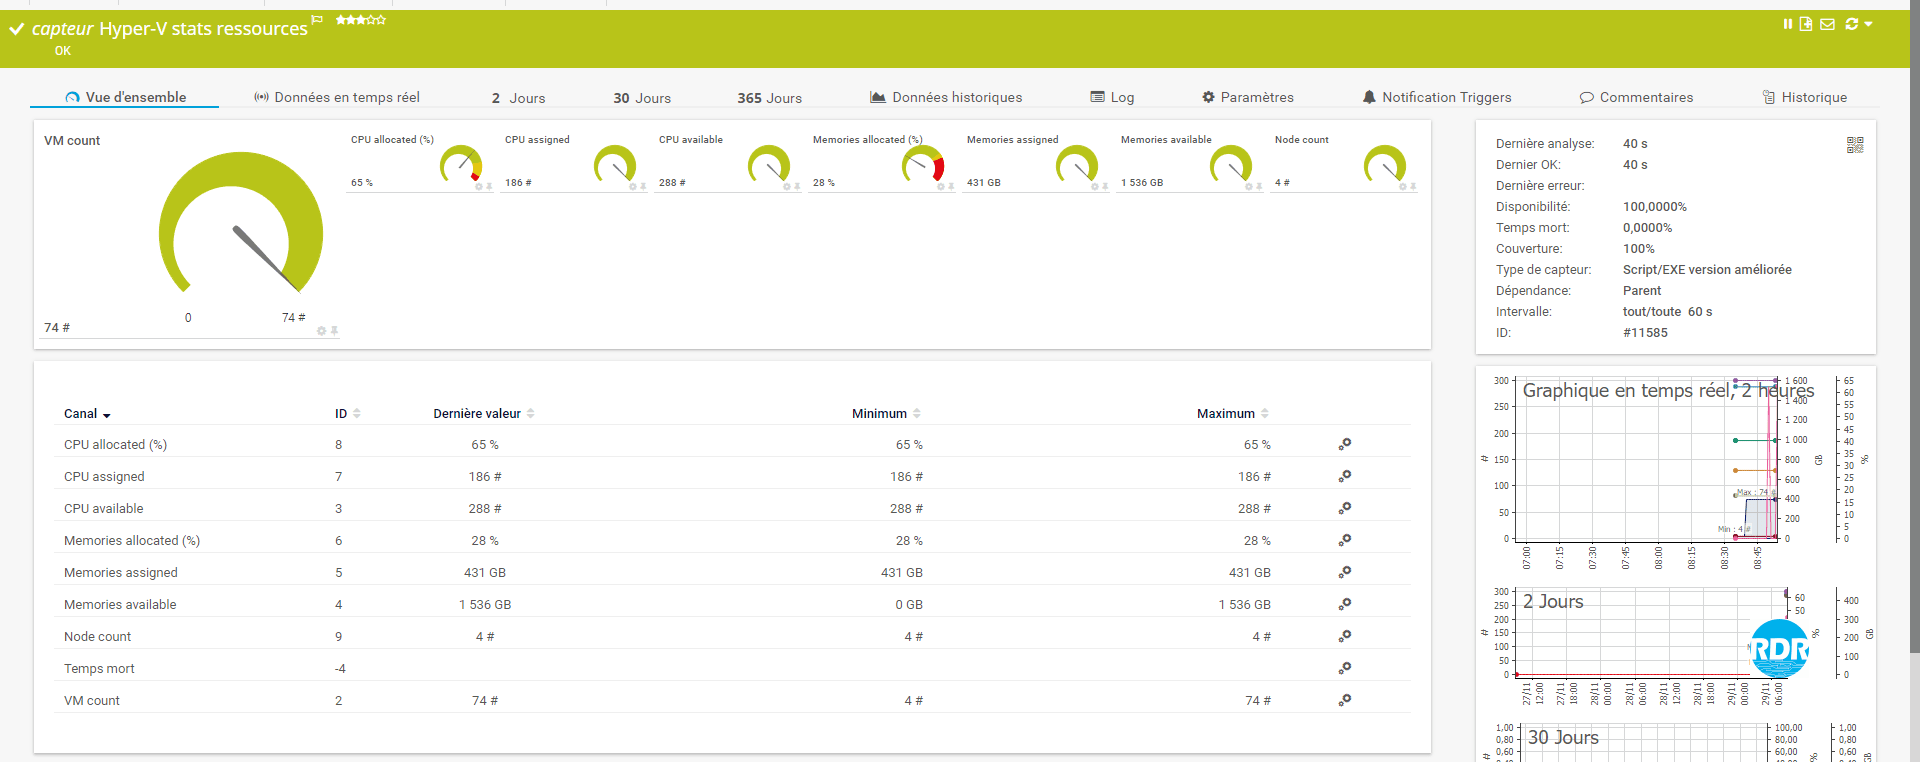
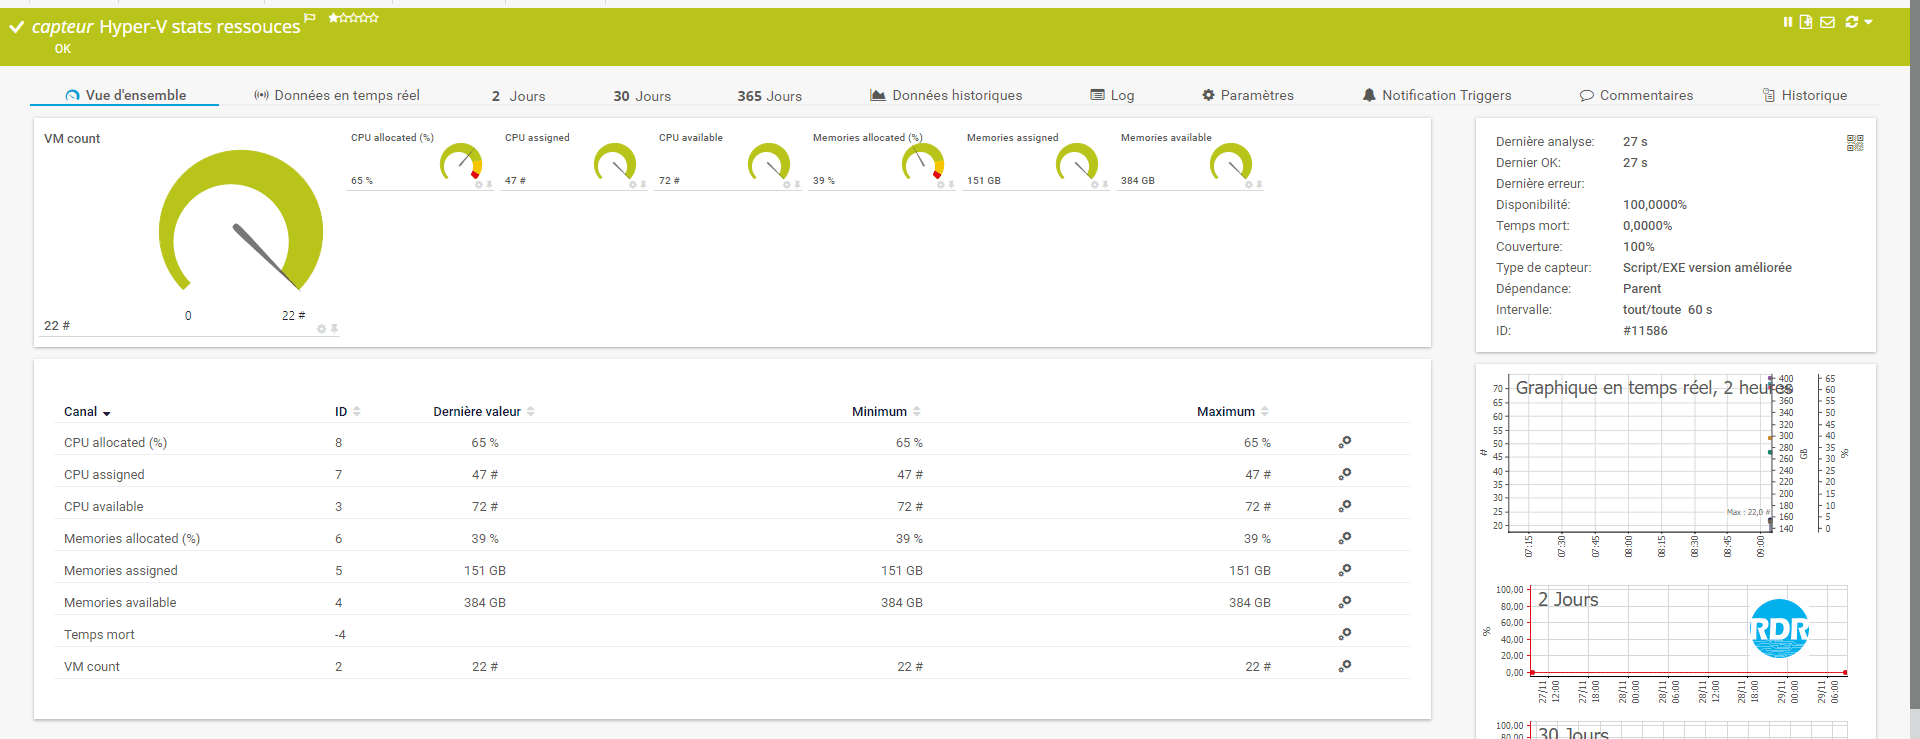
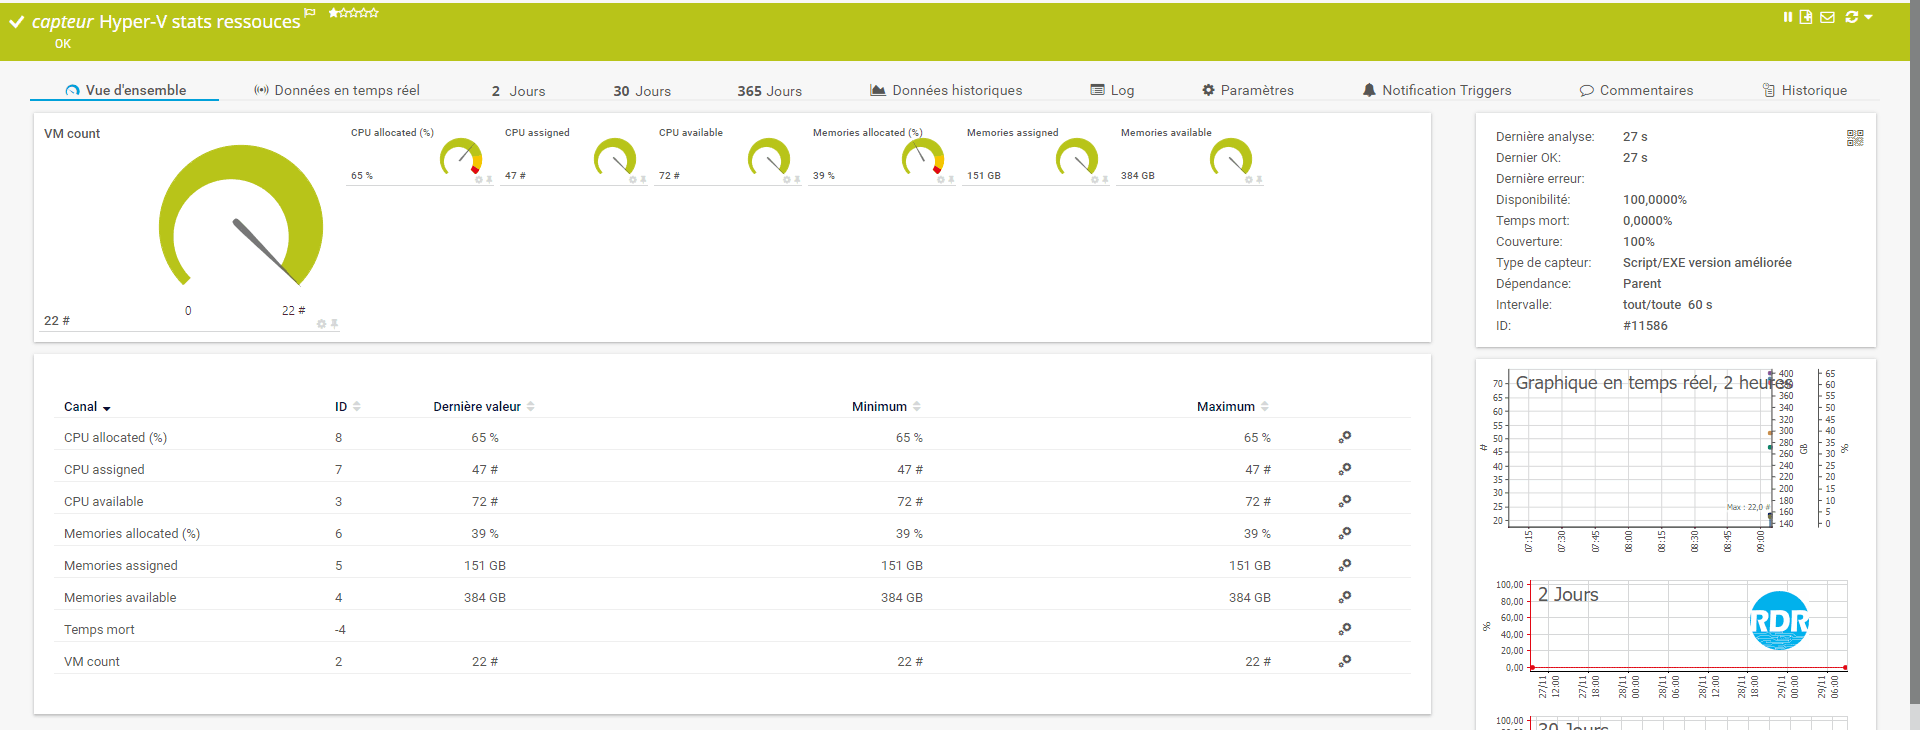
- VM Count : number of virtual machines
- CPU allocated (%) : percentage of logical CPUs allocated to VMs.
- CPU assigned : number of CPUs assigned to the VMs.
- CPU available : total number of CPUs available.
- Memories allocated (%) : percentage of memory allocated to VMs.
- Memories assigned : amount of memory assigned to the VMs.
- Memories available : amount of memory available.
- Node count (cluster) : number of nodes in the Hyper-V cluster.
The memory % memory alert on a cluster is calculated to tolerate the loss of a node.
- for 2 servers: 50%
- for 3 servers: 66%
- for 4 servers: 75%
- …
Installation
1. Unzip the downloaded archive.
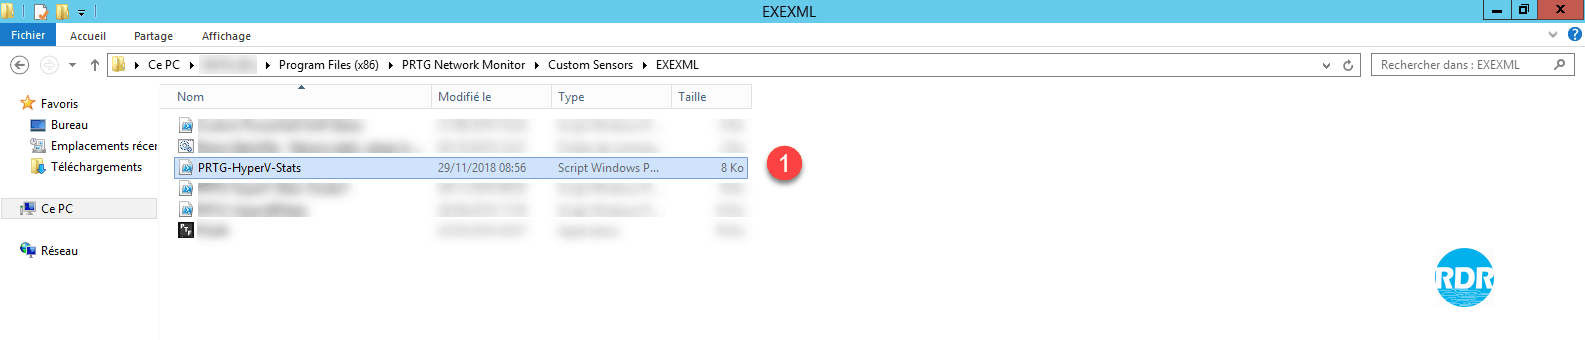
2. Copy file PRTG-HyperV-Stats.ps1 1 in the folder C:\Program Files (x86)\PRTG Network Monitor\Custom Sensors\EXEXML
Configuration for a Hyper-V host
Prerequisites:
- Hyper-V Management PowerShell command installed on the PRTG server.
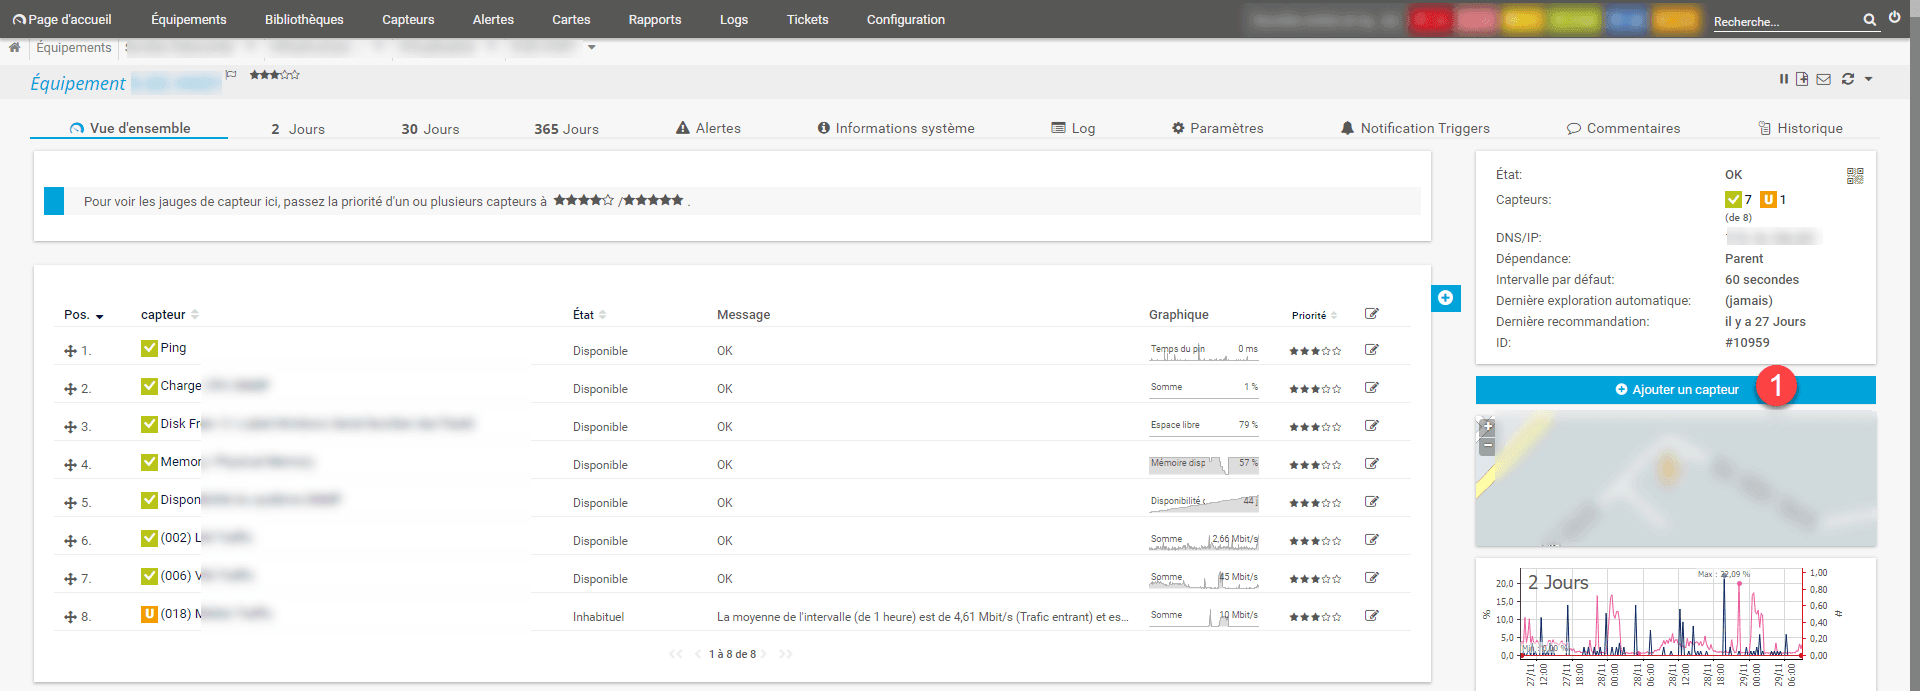
1. From the web interface or the PRTG console, go to the host you want to monitor and click Add sensor 1 .
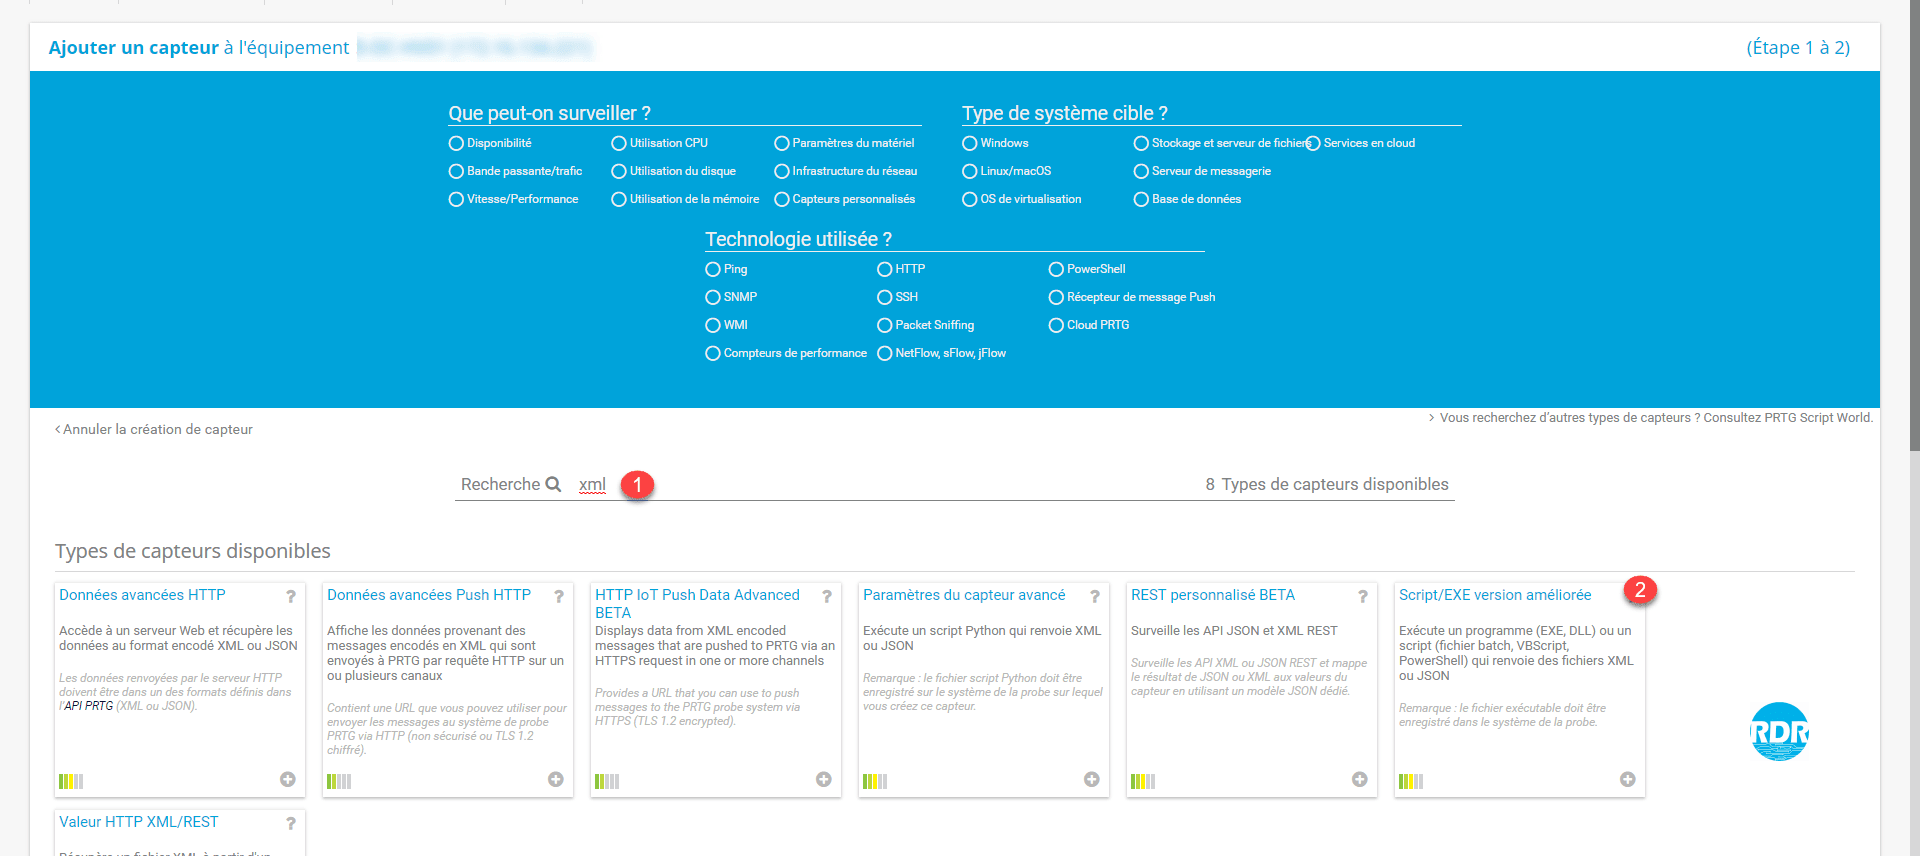
2. In the search box between xml 1 and click on the sensor Script/EXE improved version 2 .
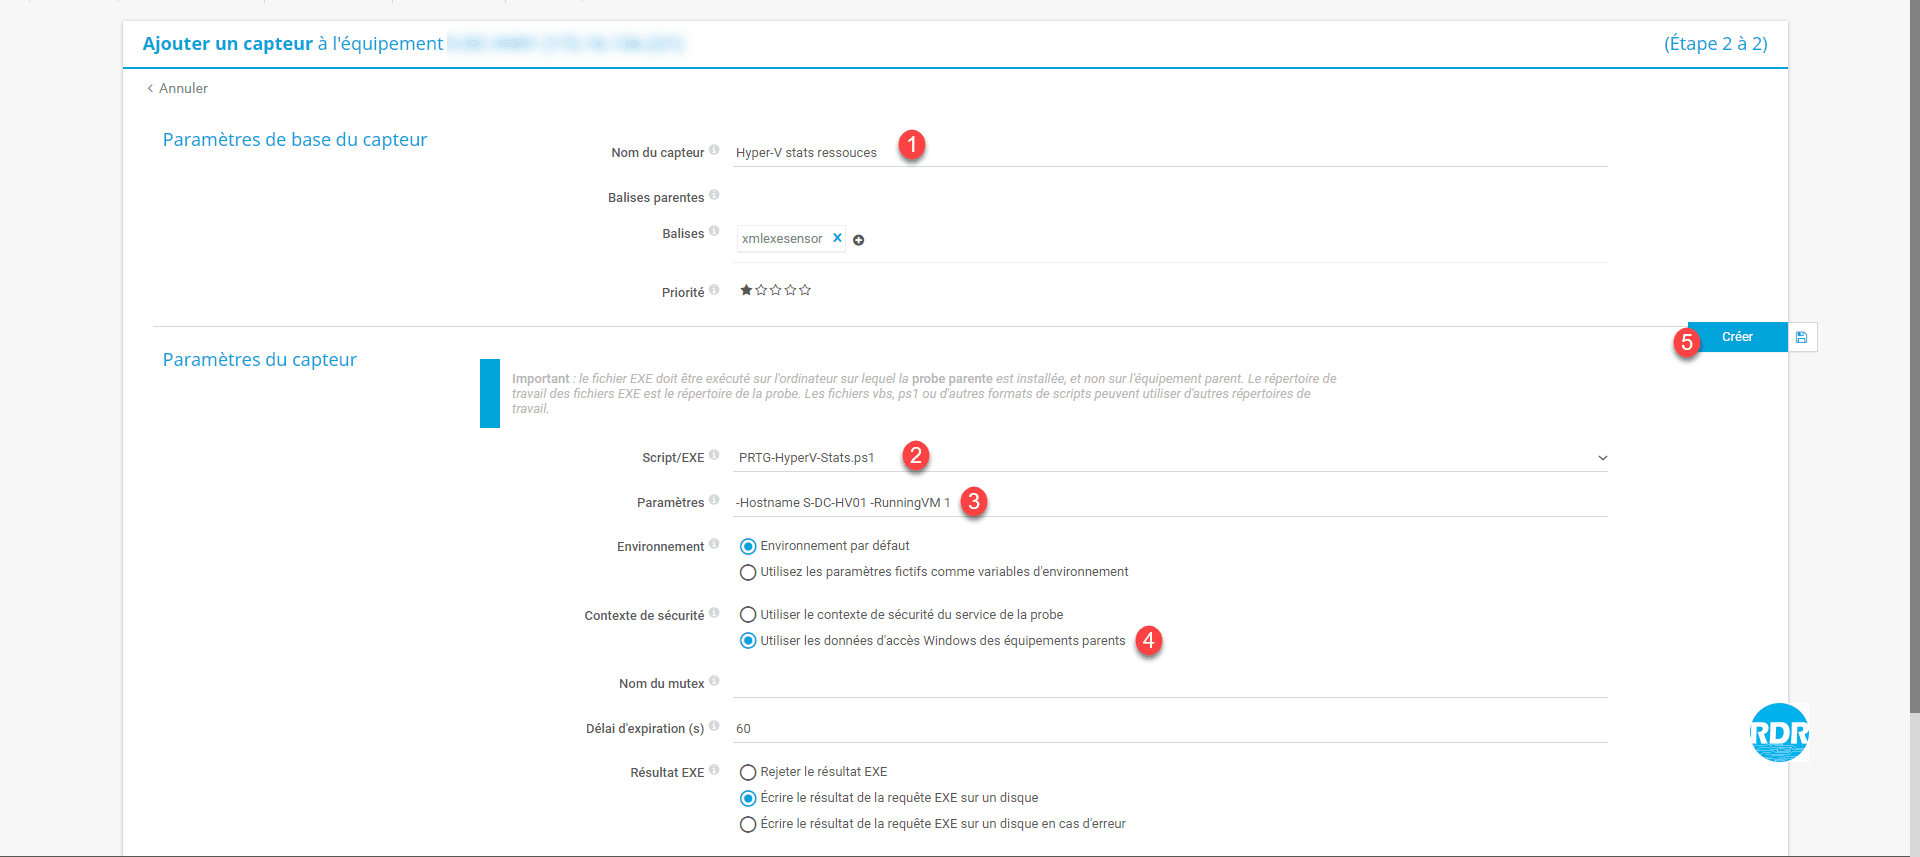
3. Name the sensor 1 , in Scripts / EXE select the file PRTG-HyperV-Stats.ps1 2 , enter the parameters 3 , choose Use Windows access data of the parent devices < <4 >> and click on Create 5 .
Settings :
- -Hostname <!NAME_OF_SERVER_HYPER_V!>
- -RunningVM 0|1 : determines if the script only scans the powered on virtual machines
4. The sensor is added, click on 1 .
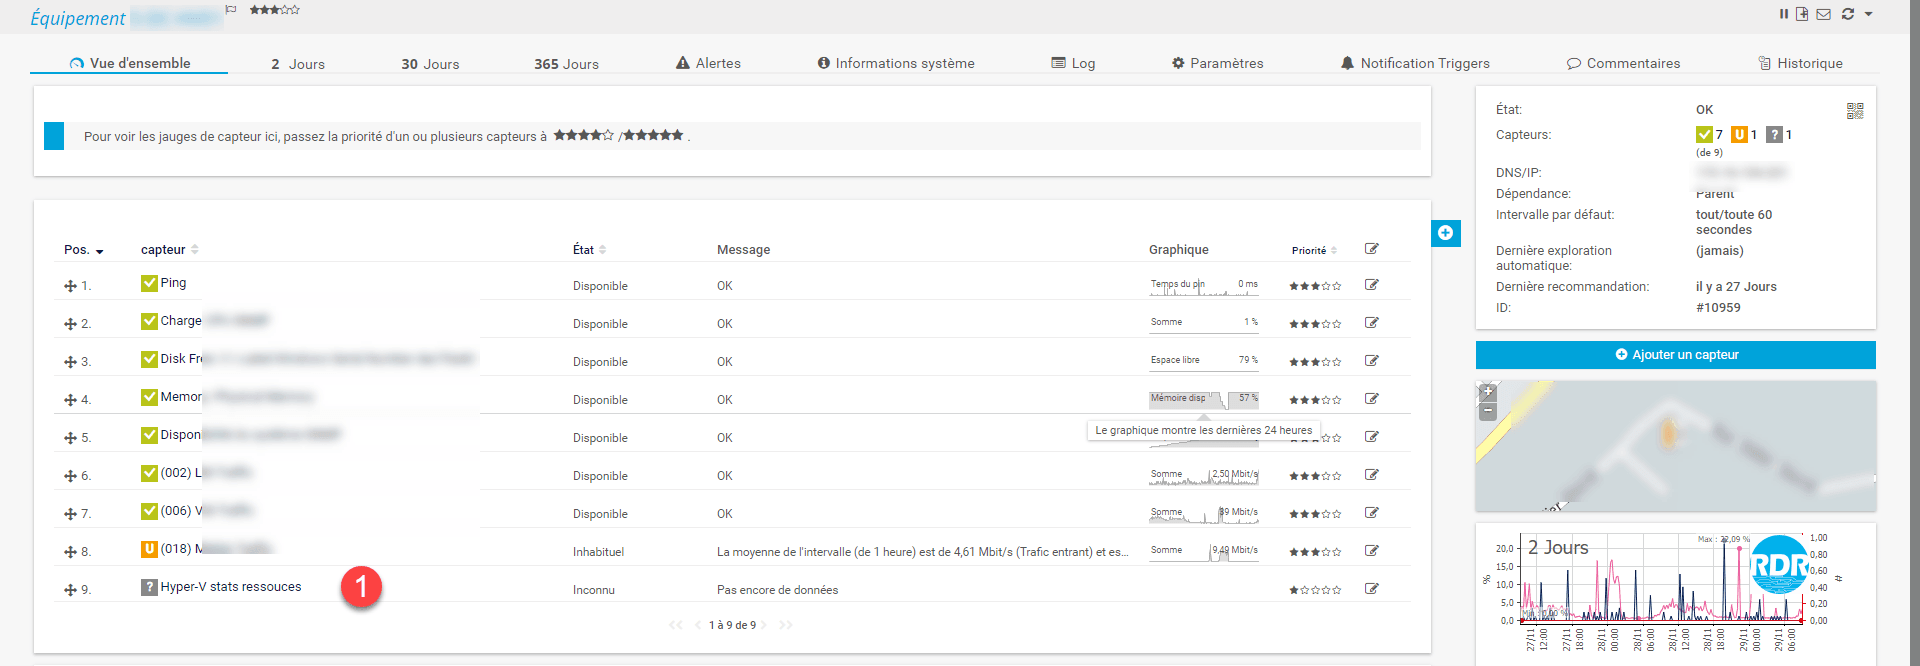
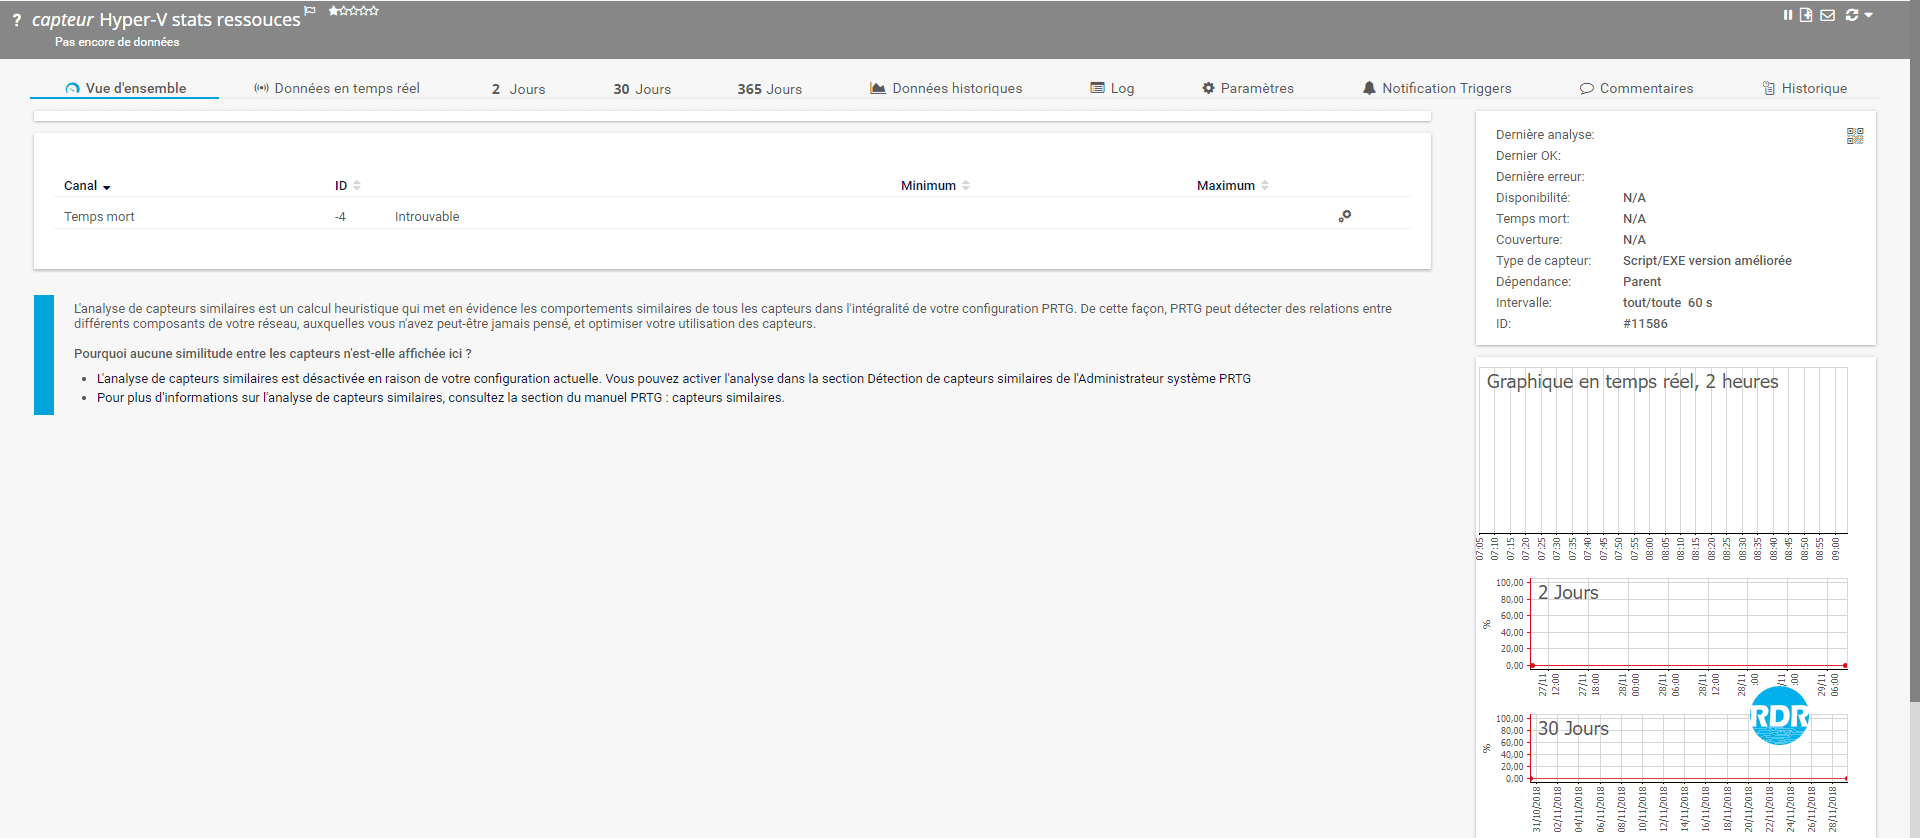
5. Wait while PRTG launches the first analysis …
6. Result of analyzing the allocation of resources on a Hyper-V host.
Installation and configuration for a Hyper-V cluster
Prerequisites:
- Hyper-V Management PowerShell command installed on the PRTG server.
- PowerShell cluster management command installed on the PRTG server.
- PSx64.exe to install in the C:\Program Files (x86)\PRTG Network Monitor\Custom Sensors\EXEXML
1. Go to the folder C:\Program Files (x86)\PRTG Network Monitor\Custom Sensors\EXEXML and make a copy of the file PRTG-HyperV-Stats.ps1 (example: PRTG-HyperV-Stats_CLUSTERNAME.ps1) 1 .
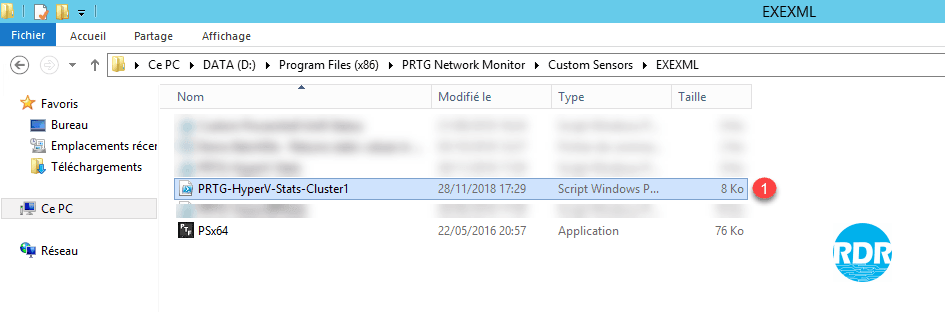
2. Edit the file modifying the following variables:
- [bool]$IsCluster = $True
- [string]$HostName = “DNS-NAME-CLUSTER”
3. From the web interface or the PRTG console, go to the host you want to monitor and click Add sensor << 1>.
4. In the search box between xml 1 and click on the sensor Script/EXE improved version 2 .
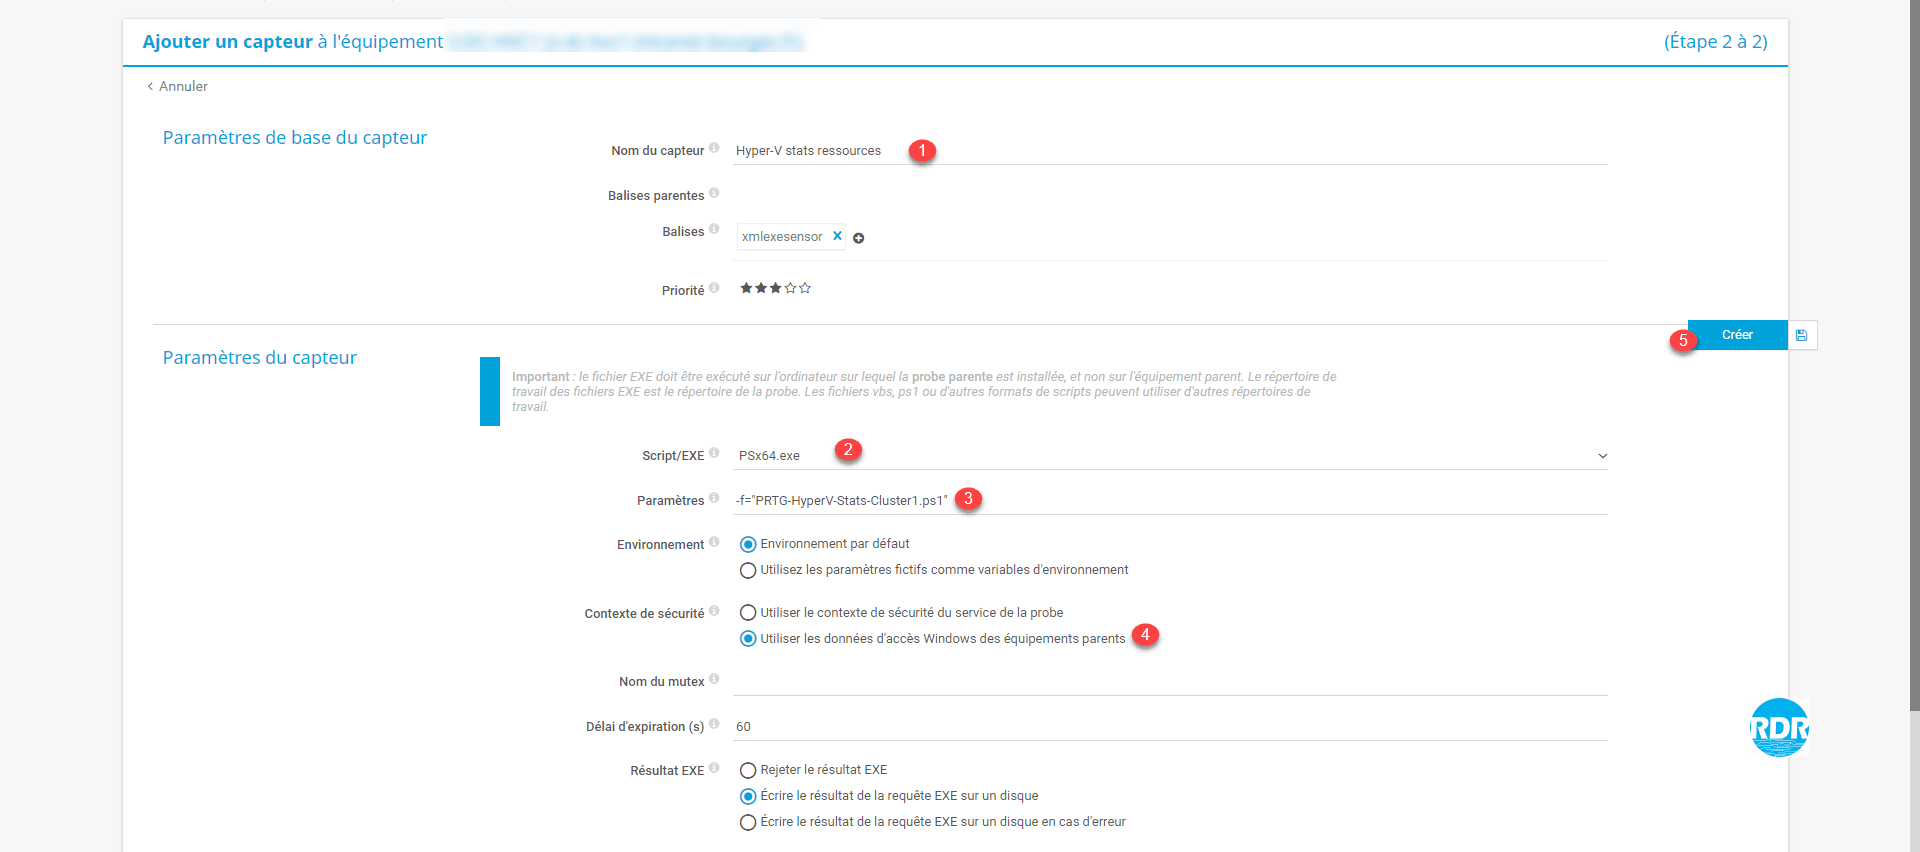
5. Name the sensor 1 , in Scripts/EXE select the file PSx64.exe 2 , enter the parameters -f=“PRTG-HyperV-Stats_CLUSTERNAME.ps1” 3 , choose Use data Windows access of parent devices 4 and click on Create 5 .
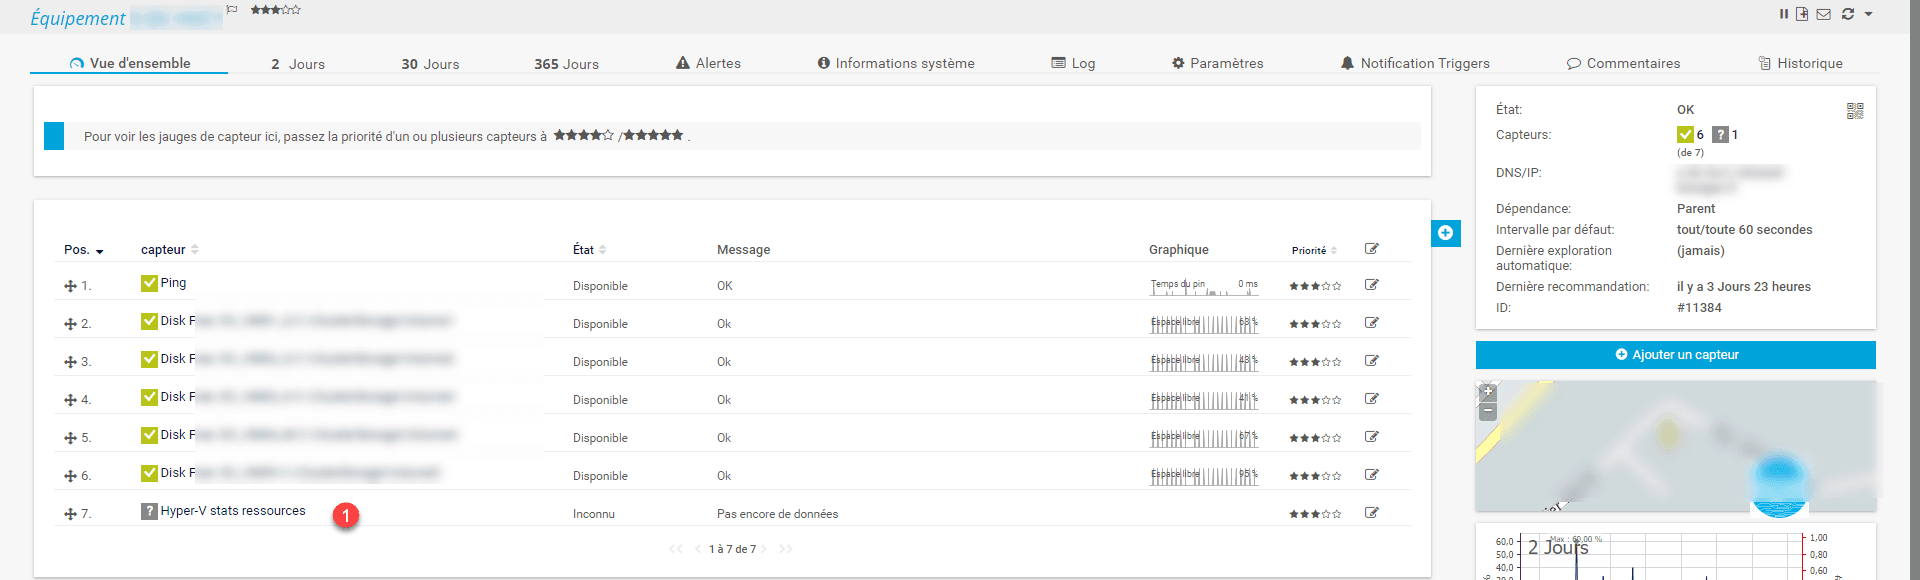
6. The sensor is added, click on 1 .
7. Wait while PRTG launches the first analysis …
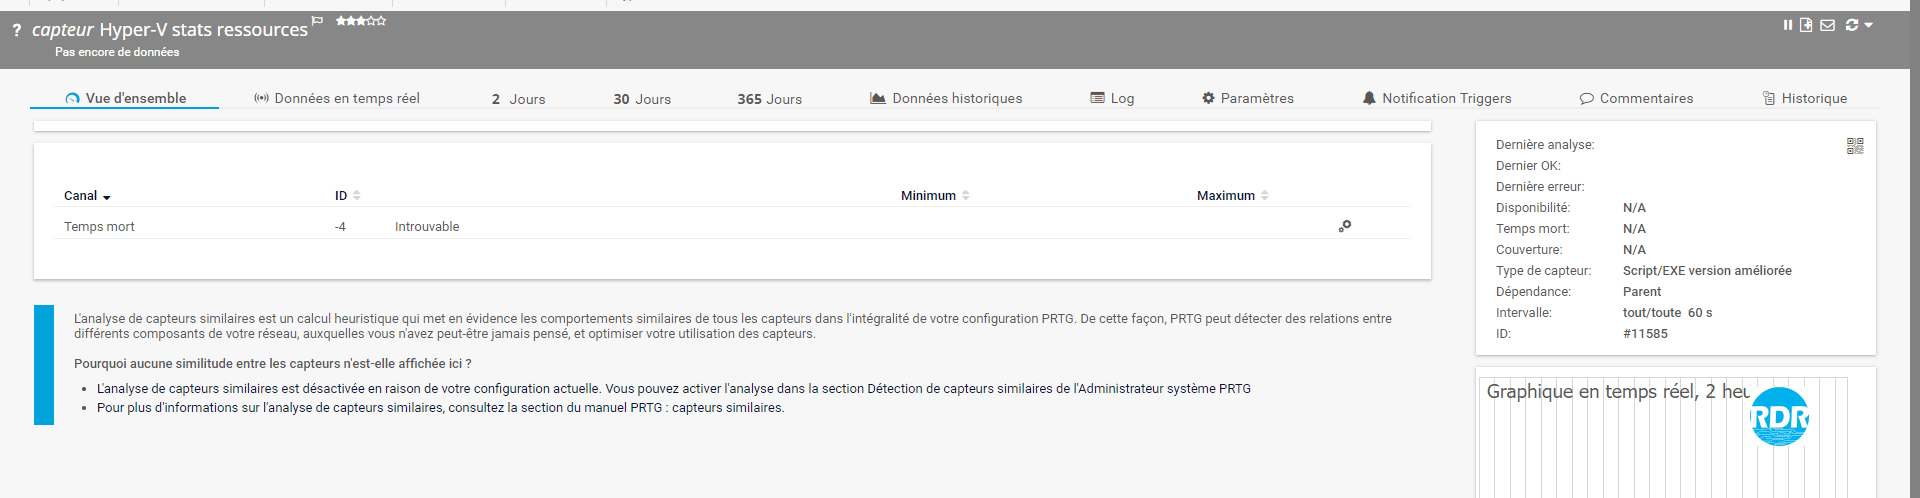
8. Result of analysis of the allocation of resources on a Hyper-V cluster.